Firewall
This chapter covers some aspects related to service firewall <id>,
which is the main element for protecting the OSDx system against
attacks and detected threats.
The firewall can work in two ways:
Analyzing all the network traffic, deciding whether it is good or bad and dropping it when necessary.
Analyzing all the network traffic, but only generating alerts when the received flow is considered to be bad or malicious (despite it being accepted anyways).
The former one is known as the IPS (Intrusion Prevention System) mode, while the latter is known as the IDS (Intrusion Detection System) mode. This behavior can be customized within the configuration, and will be explained further on.
Note
The manner in which the firewall behaves (determining which traffic is malicious and which one is not) is not an intrinsic feature of the firewall itself, but rather of the rules applied to it. When it comes to the foregoing two modes, the first one can be defined using a rule like the one below:
drop any any any -> any any (msg: "drop all packets"; sid: 1;)
This will effectively drop all packets on the incoming queue and generate an alert similar to this:
[drop] drop all packets
The second mode will accept all packets but generate an alert similar to this one:
[wDrop] drop all packets
This means packets will be dropped when the IPS mode is used.
As mentioned above, the firewall requires a set of rules in order to work. Broadly speaking, a ruleset is a file containing many rules that define the way a firewall behaves when a certain type of traffic is received. The firewall supports rules that check for source/destination IP addresses, ports, content in the packet header, selector-based info on some traffic labels and so on.
Both elements (working mode and the rules applied) are at the core of any firewall solution. Several configuration options, which have not been explained yet, allow you to customize the firewall even further.
Configuration
To change how the firewall behaves, you need to set the mode
command. It supports two options:
inline, which requires you to configure a queue (or queues) for the firewall to read from, setting it in IPS mode.
monitor, which requires you to define an interface (or interfaces) for the firewall to read from, setting it in IDS mode.
These settings are available under the following path:
set service firewall <firewall_name> mode <mode> <options>
A sample configuration to set the firewall in IPS mode will require the following steps:
Create a
traffic queue <txt>with, at least, one queue that will be used to send traffic to the firewall.Create a
traffic policy <txt>that adds all the traffic received to thetraffic queue <txt>defined above.Assign the
traffic policy <txt>created to one or many interfaces as input, output or both.Define the firewall mode as
inline, indicating the queue data should be read from.
Translated into CLI commands:
set traffic queue Q1 elements 1-4
set traffic policy P1 rule 1 action enqueue Q1
set interfaces ethernet eth0 traffic policy in P1
set service firewall F1 mode inline queue Q1
Tip
As you may have noticed, a total of 4 queues have been defined (queue
1 to queue 4: 1-4). When adding traffic to multiple
queues to feed an application, such as the firewall, load
balancing is done. As such, applications
may spawn multiple processing units to handle bigger
workloads and perform better. If the application does not support multi-queueing,
you can opt for only defining one queue (i.e., by
defining a single-item queue).
When defining multiple queues for load balancing, the total number
of queues must never exceed the total number of logical
system cores (to prevent it from becoming overloaded). At OSDx,
checking the number of cores available can be done by querying show version.
Since the configuration presented here may seem complex, further information about traffic policies can be found at the Traffic Policy and Traffic Queue chapters.
Setting the firewall in IDS mode is easier, since the configuration only requires defining which interfaces to read from:
# Configuration to read from a single interface
set service firewall F1 mode monitor interfaces eth0
# Configuration to read from multiple interfaces
set service firewall F1 mode monitor interfaces eth0,eth1,eth2
Defining the rules
As previously mentioned, the firewall requires two basic settings to work: mode and rules. Rules are what define which actions to take against incoming/outgoing traffic.
A rule is written as follows:
drop tcp $HOME_NET any -> $EXTERNAL_NET any (msg:”ET TROJAN Likely Bot Nick in IRC (USA +..)”; flow:established,to_server; flowbits:isset,is_proto_irc; content:”NICK “; pcre:”/NICK .*USA.*[0-9]{3,}/i”; reference:url,doc.emergingthreats.net/2008124; classtype:trojan-activity; sid:2008124; rev:2;)
This rule has been extracted from the Emergin Threats repository (an open database featuring lots of rules that can be freely downloaded) and will be used to explain its structure.
Action
The action is the first part of the rule itself. In this
particular example, drop. Valid actions are:
alert– only generates an alert.
pass– stops further inspection of the packet.
drop– drops the packet and generates an alert.
reject– sends an RST/ICMP unreachable error message to the sender.
rejectsrc– same asreject.
rejectdst– sends an RST/ICMP error packet to the receiver.
rejectboth– sends RST/ICMP error packets to both sides.
Note
In IPS mode, using any reject action also enables drop.
It is worth mentioning that the actions defined above will be applied in a specific order. This means that, for example, if a packet matches a rule with an action that prevents further processing, then the rest of the rules will be skipped.
This is the default priority order:
pass
drop
reject
alert
But it can be configured by using the following command:
service firewall <id> action-order <id>. Example:
set service firewall F1 action-order "drop, pass, alert, reject"
Protocol
The second word in the rule refers to the protocol. In this case, tcp.
It is used to define the kind of traffic that will be analyzed by the rule itself. There are
four main protocols:
tcp
udp
icmp
ip(which stands for all kinds of traffic)
A few so-called application layer protocols or L7 protocols
are also available (such as ssh, http, dns, http2).
Source and destination
Source and destination are, in the rule, the $HOME_NET and
$EXTERNAL_NET parts respectively. Using both, the user can specify
the traffic the rule will apply to based on its source and
destination addresses. Valid values are IP addresses and IP ranges.
The source and destination tools are some of the most powerful features when filtering traffic, not only because of their definition (IP addresses and IP ranges) but because of the operators that can be used. The following operators are currently available:
Operator |
Description |
|---|---|
|
IP ranges in CIDR notation |
|
Negation/exception |
|
Grouping |
With this in mind, a few examples illustrating their potential are presented below:
Example |
Meaning |
|---|---|
|
Every IP address but |
|
Every IP address but |
|
|
|
|
Ports (source and destination)
Ports are, in the rule, any keywords which correspond to the
source port and destination port, respectively. Traffic comes in and
goes out through ports. They usually represent applications that receive data,
not protocols (despite that, HTTP is often linked to port 80 while
HTTPS uses port 443).
When ports are used to filter traffic, the destination port is often the only one defined, whereas the source one is typically randomly assigned by the operating system. That is why, when filtering an HTTP service, the rule to write is:
any -> 80
which implicitly means:
Traffic from any source port that goes to port 80
In addition to Source and destination, some operators allow combining ports and options:
Operator |
Description |
|---|---|
|
Port ranges |
|
Negation/exception |
|
Grouping |
In this case, the main difference is that port ranges are indicated using a colon. Below are some examples:
Example |
Meaning |
|---|---|
|
Ports |
|
From port |
|
From port |
|
Every port but |
|
From port |
|
From port |
Direction
Another interesting element present in rules is the direction. It
is represented by an arrow (->), showing in which way
the signature has to match. In this example, the right arrow indicates that
only packets with the same direction (from $HOME_NET any port
to $EXTERNAL_NET any port) are allowed.
However, there is another “arrow” that indicates traffic may
match whichever direction: <>.
Warning
Please note there is no “reverse” direction (i.e.: no <-).
Options
Once the rule traffic structure has been defined, there are
options that give the rule its full meaning. Options must be enclosed
between parenthesis and separated by semicolons (;). Some
options have settings (for example, msg, which requires a message
in between commas), while others do not (such as bypass,
which is simply a keyword):
<keyword>: <settings>;
<keyword>;
Some proprietary keywords that were added by Teldat will be commented in the chapter below. The others are exactly the same as the ones being already offered.
Now that the way rules are structured has been explained, it is time to add them into the firewall. The latter currently supports two types of rule formatting:
Plain-text files, that can be optionally encrypted, containing many rules to be applied by the firewall.
Compressed TAR folders containing one or more rule files (which can also be encrypted).
Note
If any of the rule files is encrypted, the algorithm
used must be AES-CBC, and sometimes PBKDF2 as derivation
algorithm. The key length must be one of 128, 192 or 256
and the digest algorithm used when deriving the key must be
md5, sha1, sha256, sha384 or sha512.
Tip
To optimize security and keep your intellectual
property intact, use AES-256 CBC with SHA-512 as digest, a
strong password and at least 10000 iterations derivating with
PBKDF2.
The path to configure the ruleset for the firewall is:
set service firewall <firewall_name> ruleset <ruleset_source> <options>
For example, to define a ruleset for a single downloaded file, the command will be:
set service firewall F1 ruleset file running://rules/my.rules
If there are multiple files that must be present when running the firewall, insert the above command multiple times (just indicating what file to use):
set service firewall F1 ruleset file running://rules/my-other.rules
Note
Additionally, each individual rule configuration can be encrypted
separately. Internally, the configuration system checks that
the MIME type of the file looks like this: application/octet-stream.
If it does, it means it is encrypted. If not encrypted, the file
must be set to text/plain to avoid errors.
Moreover, if the firewall needs to use an encrypted and compressed ruleset, this can also be specified alongside the other ruleset:
set service firewall F1 ruleset compressed running://rules/compressed.rules
# Then we set the password, the derivation algorithm and more
set service firewall F1 ruleset compressed running://rules/compressed.rules password EXAMPLE
set service firewall F1 ruleset compressed running://rules/compressed.rules digest md5
set service firewall F1 ruleset compressed running://rules/compressed.rules key-length 192
Tip
When working with compressed rulesets, it is possible to choose which individual files will be used. For example, imagine the compressed file contains 15 individual rulesets but only 5 can be used (due to memory restrictions). Picking five can be easily done:
set service firewall F1 ruleset compressed running://rules.tgz file file_1
set service firewall F1 ruleset compressed running://rules.tgz file file_2
set service firewall F1 ruleset compressed running://rules.tgz file file_3
set service firewall F1 ruleset compressed running://rules.tgz file file_4
set service firewall F1 ruleset compressed running://rules.tgz file file_5
...
Here, file_n is the name of the file to be used. If the ruleset is
not encrypted (only compressed) completion will show the files
inside it.
Note
Encrypting the rules is always a good idea if the device running the firewall is prone to attacks and the rules in use are “sensitive” (i.e., being developped at the time or on sale).
The firewall configuration daemon is flexible when it comes to decrypting/decompressing and allows nesting. This means that the encryption can be applied to the compressed ruleset as a whole, only to the files inside it, or to both (ruleset and files), provided the method used is exactly the same (including the password).
A use case detected during development was to update several rules after the device had been deployed. One major issue (even bigger when working with cloud providers) is the cost of transmitting files over the network: rulesets can be huge (tens of megabytes to hundreds of them) and sending the file over and over to update a single line in only one ruleset makes no sense.
For that reason, the ruleset command also supports the patch command,
which allows the configuration of several files to be applied to
specific rules during firewall deployment. As with the other options,
patches can be both compressed and encrypted and must
follow the GNU unified patch format.
Warning
For a patch to work, it MUST MATCH the name of the file exactly. Below are some examples of patches that will be applied and patches that will not:
Patch filename |
Ruleset filename |
Applies? |
Reason |
|---|---|---|---|
|
|
Yes |
The filename is the same (without the extension) |
|
|
Yes |
The filename is the same (without the extension) |
|
|
No |
The filename is not the same: |
|
|
No |
The filename is not the same: |
This way, the minimal amount of bytes required to change the rules can be sent.
Important
If many rules are being applied to the firewall, the system may seem unresponsive while the firewall is initializing. This can last up to 5 minutes, but, after such time, it will abort the commit.
It is worth mentioning that at least one working
rule is needed. If not, the firewall will not start and the commit will fail.
If any of the rules are incorrect or an error occurs during firewall
startup, the system journal will show the problem.
This only works if the firewall logging
level is set to notice (at the very least).
Traffic processing algorithms
One of the core parts of the firewall is known as MPM –
Multiple-Pattern-Matcher and belongs to the detection engine of
the firewall itself. For a rule to be triggered, all the patterns
present in the signature must match. The MPM will select a pattern
per signature and use it to analyze incoming packets.
This section is critical in terms of performance, since a signature is only deemed to have been applied over a packet if all of its patterns match the packet (thus skipping rules that do not match).
The available algorithms are:
hyperscan, a high-performance RegEx matching library that offers the best performance available. Its main disadvantage is that it is only available onx86_64platforms supporting vectorizedSSE2operations.
ac, which stands for Aho-Corasik. It’s the basic RegEx matching library to balance performance and memory usage.
ac-bs, an optimized version of theacalgorithm that uses less memory at the cost of performance.
ac-ks, a variant of theacalgorithm that gives the best performance overall (for Aho-Corasik algorithms) with a higher memory usage.
autowill automatically choose the best algorithm available in terms of performance depending on the platform the firewall is currently running on. This is the default option.
Note
The chosen algorithm will have a direct impact on firewall performance and memory usage. Some measurements we took gave the following results:
Algorithm |
Overall memory usage (%) |
Overall CPU usage (%) |
Throughput ( |
|---|---|---|---|
|
\(3\%\) |
\(318.8\%\) |
|
|
\(12.2\%\) |
\(320\%\) |
|
|
\(12.5\%\) |
\(720\%\) |
|
All of the above tests ran for 30 minutes. The maximum expected throughput for all tests is * ``1 Gbps`` *. The first two tests were executed on the same ARM64 device, while the third one run on an AMD64 device supporting hyperscan. The maximum CPU usage for the first two tests was \(400\%\) , while the third one reached \(800\%\). Please note that the results presented above are meant purely for information purposes, to best determine what algorithm to choose. They ARE NOT results you may expect or any kind of guaranteed performance.
Setting the algorithm is done as follows:
set service firewall <firewall_name> algorithm <algorithm>
Tip
The auto algorithm is used by default, helping the firewall
choose the best available option for the platform.
Runmodes
The firewall is made up of multiple running units that process the packets. The runmode defines the manner in which packets will be treated by the firewall.
There are currently two options available: workers and autofp.
The first one usually works better: the network card makes sure packets
are properly distributed among the firewall’s processing units:
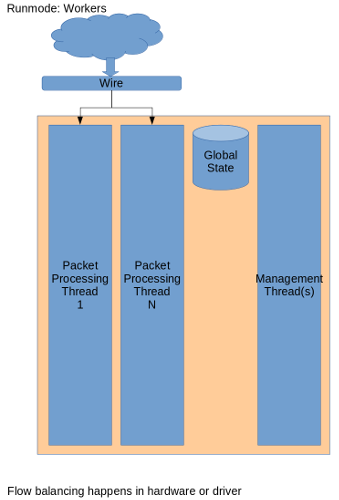
The latter (autofp) works similarly to workers, but it also involves
the firewall when balancing the load (slowing it down).
Tip
By default, the workers mode is generally in use since it gives the
bests performance. Ideally, one may test the firewall with a combination
of the Traffic processing algorithms and different runmodes to
achieve the best performance.
The path to set the runmode is:
set service firewall <firewall_name> runmode <mode>
Detect Thread Ratio
The number of processing units previously mentioned are controlled by the number of CPU cores and the detect thread ratio.
This value will set a fixed number of processing units that will
handle incoming packets. By default, it has a value of
1.5 (which means the number of processing units is higher than that of
available cores). This may be convenient at times when a
processing unit must be ready for the remaining processing to
become active.
Note
Setting a value lower than 1 implies that less processing units
are created. For example, in a dual-core scenario, a ratio of
0.5 means that only one processing unit will be created. It is
worth mentioning that, regardless of the value set here, a minimum of 1
processing unit will always be created.
The path to set the detect thread ratio is:
set service firewall <firewall_name> detect-thread-ratio <ratio>
Maximum Pending Packets
Following the performance tweaks, the max pending packets setting defines the amount of packets that can be simultaneously processed by the firewall. It can range from only one packet to tens of thousands of packets.
This setting sets a trade of higher performance and more memory usage
against lower performance but lower memory usage. By default, 1024
packets are processed simultaneously, which usually strikes a good balance
between performance and memory usage.
Warning
Choosing a low number of packets to be processed while many CPU cores are available squanders the router’s capacity.
The path to set the maximum pending packets setting is:
set service firewall <firewall_name> max-pending-packets <packets>
Flow
Flow options allow configuring some firewall performance features that help improve performance or reduce it to save memory (i.e.: for low-end embedded devices).
When talking about flows, we really analyze how the firewall internally
handles connections. It is fairly similar to conntrack,
but the firewall flow options are slightly more generic.
To determine whether a packet belongs to a flow, we rely on the concept of tuple. Thus, all packets with the same tuple (protocol, source IP, destination IP, source port and destination port) belong to the same flow:
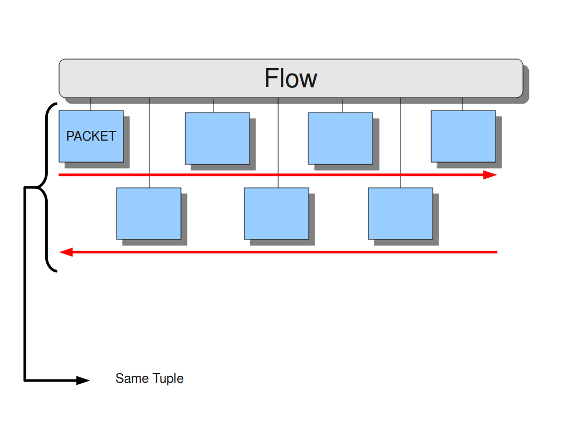
However, keeping track of all these flows consumes memory. The higher the number of flows, the greater the memory used. Although it may seem only memory is affected, performance is impacted too: creating a flow is expensive in terms of computing and is an entrypoint for attackers to DoS a system. The settings available to control flows will be explained below.
Hash size
Flows are organized inside a hash table to look up an incoming packet fast. Hash tables have constant time access to any of its items, regardless of its length. This is known as \(\mathcal{O}\left(1\right)\) in item lookup.
This setting limits the size of the hash table so that (if the value is lower)
less memory is consumed. By default, it is set to 65536:
set service firewall <firewall_name> flow hash-size <size>
Maximum memory
Since flows consume memory and the firewall can receive tens of thousands of packets, this setting prevents it from saving too many flows and exceeding the value set.
If the firewall ever reaches this value, it will enter the emergency mode,
setting shorter timeouts for all incoming and existing flows. This means they
will expire earlier on, freeing memory faster (so there is more capacity for new
flows). By default, this is set to 128MB:
set service firewall <firewall_name> flow max-memory <memory>
Note
When the value set in max-memory is reached, the firewall
always switches to emergency mode (regardless of the
value set at Prealloc ). This cannot be prevented.
Prealloc
When packets do not yet belong to a flow, the firewall creates one. As mentioned earlier, this is an expensive operation that attackers can use to compromise the firewall.
Imagine the following scenario: an attacker is flooding the system by sending a lot of packets with different tuples (source and destination IPs, source and destination ports and protocol type). This causes the firewall to create a new flow for every received packet. After a while, the system will be at risk because the firewall won’t be able to keep up with the required load and therefore will stop processing incoming traffic (this is known as DoS or Denial of Service).
This setting, however, instructs the firewall to keep a fixed number of flows saved in memory so they can be used for incoming packets instead of having to create new ones.
Warning
While this setting does not prevent the above kind of attack, it can help mitigate its impact. Selecting a higher value will increase the chances of avoiding such attacks. The only drawback is memory usage, which would increase from when the firewall is first started.
The default setting is to keep 10000 flows in memory:
set service firewall <firewall_name> flow prealloc <flows>
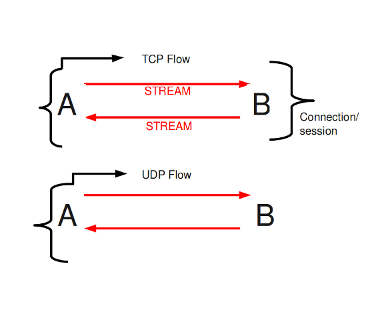
Stream
Finishing with the performance settings, we have streams (in particular, TCP streams). TCP is the most common protocol and allows you to define specific behavior when analyzing traffic.
The stream setting directly affects the flow processor unit. The processor unit takes care of tracking the initiated TCP sessions and rebuilding them when done.
There are some features for skipping TCP packets/flows if necessary. These options are used to skip a single packet, an entire flow or entire sessions.
Async one-side
The firewall can usually detect all packets belonging to a flow. It is possible, however, for one side of the flow to go on a different path to the other side, which means that it is asynchronous.
When this option is enabled, the firewall is instructed to detect this kind of scenario to avoid “getting confused”:
set service firewall <firewall_name> stream async-oneside
Bypass
The Bypass feature allows you to skip an entire flow when the analyzed packets meet certain conditions.
Warning
Bypassing ultimately means not having to analyze traffic, which significantly improves performance. This feature must be used with care as there is always the possibility that malicious traffic will pass through, possibily leading to a security issue.
There are four different types of bypass set up in the firewall:
Local bypass, in which the firewall notes the traffic to be ignored so it can be omitted when it reaches the processing units. This is the slowest option.
Capture bypass, in which the firewall marks the packet or the flow so an external Netfilter/IPTABLES rule can forward the traffic out of the firewall. This can a faster option. Negative capture bypass-drop is also available, allowing the flow to be marked so an external Netfilter/IPTABLES rule can drop the traffic before reaching the firewall.
Traffic offloading, in which the firewall marks a flow to be possibly offloaded, leveraging this task to the offload engine. When offloaded, the flow skips the entire network stack and goes straight to the outgoing interface. This can be the fastest option.
Traffic early dropping, in which the firewall detects a packet belonging to a flow as malicious. It stores the flow on a dropping table so that the traffic can be dropped as soon as possible. In this case, this means that the traffic is either dropped directly on the NIC or later when received by the kernel.
Note
Some measurements showed the local bypass feature reaching a peak of
899 Mbps while the capture bypass went up to 39 Gbps
(source: Bypass feature).
On the other hand, traffic early dropping is successfully used by ISP companies to mitigate DDoS attacks, sometimes reaching peaks of hundreds of gigabits per second.
The bypass feature may be used when any of the following conditions are met:
a rule is marked with the
bypasskeywordthe stream depth is reached
the flow is detected as TLS and packet is encrypted
For the first use-case, a rule can directly avoid having to analyze traffic that is, for example, deemed “good” or harmless. Consider the case of YouTube traffic. When watching a video, hundreds or thousands of megabytes can be transmitted. Analyzing that traffic is usually of little value, so it would be better to skip it. This is possible with a rule:
alert http any any -> any any (msg: "YouTube traffic"; content: "www.youtube.com"; bypass; sid: 1;)
The above rule will match any HTTP traffic whose content is www.youtube.com
and activate the bypass feature (instructed by the bypass keyword).
This means that any further traffic of this type will be directly skipped.
In the second use-case, such behavior can be leveraged by the firewall when a certain depth has been reached. As already mentioned, streaming a YouTube video may use hundreds or even thousands of megabytes, making it possible to detect this size and mark the flow as skippable:
set service firewall <firewall_name> stream bypass depth <size>
By enabling this setting, a flow is automatically bypassed when it
reaches its maximum depth. By default, the value is set to 1MB.
If the bypass feature is enabled, the third use case needs no extra configuration. By default, once the initial handshake of a TLS flow is complete, subsequent encrypted packets are skypped from being analyzed. Analysis only continues if it is forced by a firewall rule, for example by asking to look for a specific content in the flow.
Capture bypass
Two settings must be set to enable a capture bypass:
A
mark/masktupple (from the firewall side).A
selector(from the traffic side).
The recommended mark to identify traffic to be bypassed out of the firewall is
the conntrack mark. Once set, the conntrack mark is present along the entire
traffic session.
The packet mark is also available. Using this type of mark requires some extra
configuration for the capture bypass to work since the packet mark set is only
available until the packet is sent.
set service firewall <firewall_name> stream bypass mark <packet mark>
set service firewall <firewall_name> stream bypass set-connmark
The mask is used to perform the AND operation against the configured
firewall mark. Then, the bits not covered by the mask are filled with the data
taken from the packet mark of the incoming packet, if any. The resulting
mark can be used inside a Traffic Selector for
filtering the traffic.
set service firewall <firewall_name> stream bypass mask <mask>
It is usual to set the mark directly from the firewall and then do an
inverted match from within a Traffic Selector.
For conntrack mark:
set service firewall <firewall_name> stream bypass mark <packet mark>
set service firewall <firewall_name> stream bypass mask <mask>
set service firewall <firewall_name> stream bypass set-connmark
set traffic selector <selector_name> rule <id> not connmark <conntrack mark>
For packet mark:
set service firewall <firewall_name> stream bypass mark <packet mark>
set service firewall <firewall_name> stream bypass mask <mask>
set traffic selector <selector_name> rule <id> not mark <packet mark>
Two settings must be set to enable a capture bypass-drop:
A conntrack
mark(from the firewall side).A
selector(from the traffic side).
set service firewall <firewall_name> bypass action drop set connmark mark <conntrack mark>
You can see many examples of this feature in the Examples section.
Traffic offloading
Another way to bypass traffic is to offload it to the offload engine. This is a feature that skips the network stack and forwards traffic to the outgoing interface, thereby significantly increasing performance (further information can be found at Hardware Offload).
When analyzing traffic, the firewall sets a flag in the conntrack to prevent the offload engine from offloading the traffic:
tcp 6 3596 ESTABLISHED src=... dst=... sport=... dport=... ... (Sc: not-bypass) mark=0 use=1
The above string (Sc: not-bypass) indicates that the flow is being
analyzed by the firewall and so it can’t be bypassed yet. When this
setting is enabled, the traffic can be offloaded and thus accelerated:
set service firewall <firewall_name> stream bypass action accept set conntrack offload-flag
tcp 6 3596 ESTABLISHED src=... dst=... sport=... dport=... ... [OFFLOAD ...] mark=0 use=1
Tip
Traffic offloading can be combined with Capture bypass, but it’s not really necessary: neither Netfilter has access to traffic when it is being offloaded (at least from the traffic selector’s side).
Nevertheless, there are situations where traffic cannot be offloaded (despite having set the flag for this) or where you simply do not want to forward traffic to the firewall. For such situations, we recommend setting both Traffic offloading and Capture bypass.
Traffic early dropping
The final option for the bypass feature is the early dropping mechanism. The important thing when receiving malicious traffic is to prevent it reaching the kernel and to drop it as soon as possible.
This setting allows traffic to be dropped at the highest rate possible, thus effectively mitigating DDoS attacks: where possible, traffic is dropped directly on the NIC, i.e., before the packet reaches the kernel.
When enabled, an XDP filter will be installed on associated interfaces to drop traffic identified as malicious from the firewall. The path to to enable this setting is:
set service firewall <firewall_name> stream bypass action drop set xdp-early-drop <interfaces>
Notice that it is required to define on which interfaces XDP will be attached.
Note
XDP actually runs only on physical interfaces. The firewall is smart enough to know the parent interface of a virtual interface (in case, for example, of VLANs) but on virtual-only interfaces it will simply fallback to generic mode, which runs on kernel-side and is considerably slower than native mode.
Drop invalid
There are some strange cases (if the firewall is running in a layer 2 IPS setup) where the stream engine sees blocked packets as invalid. If this option is not set, these packets will continue to be analyzed:
set service firewall <firewall_name> stream drop-invalid
Inline
The Inline setting determines the firewall’s behavior when
analyzing traffic: if set to yes, then the firewall is placed
in between stream edges and decides what to do with the traffic
(also known as IPS mode). If set to no, the firewall never
runs in IPS mode. If set to auto (the default), the decision
is made depending on the running mode:
set service firewall <firewall_name> stream inline <yes/no/auto>
Note
When reading from a Netfilter queue, this setting is always
set to yes internally.
Midstream
A TCP session starts with the so-called “three-way-handshake”. Here is when possibly the most important information is shared. After that, arbitrary information can be sent or received. As the session can last a long time, it could happen that the firewall joins late and thus misses the original setup for that session.
When this option is enabled, the firewall is instructed to continue to analyze ongoing traffic despite not having enough information to make verdicts:
set service firewall <firewall_name> stream midstream
No validate checksum
Packets have what is called a “checksum”. This field is used to verify the integrity of the packet (i.e., to check whether or not a packet is in a good state). While, by default, the firewall will not process any packets with an invalid checksum, setting this option will force it to perform the analysis:
set service firewall <firewall_name> stream no-validate-checksum
Reassembly maximum memory
This option has more to do with memory usage than with the stream itself. When rebuilding a TCP session after the firewall has analyzed all of its packets, some memory is required to be able to know the data segments of the stream.
Setting this option reserves some memory to perform the reassembly
and thus avoid starvation due to no memory being available (by default, 256MB):
set service firewall <firewall_name> stream reassembly-max-memory <memory>
Logging
The logging feature is one of the core-features of the firewall. It defines the firewall’s behavior and output when a rule matches incoming traffic, which can be reviewed later to obtain information about the system.
The logging facility controls both the output format and the output level, among other settings. There are a bunch of formats available (some of them with their respective settings) and filters can be configured so that only relevant information is extracted.
There are some other options that control logging rotation (which is critical due to the size of the registers). These will be explained further on.
Filter
The filter option in the logging settings allows you to define a RegExp (Regular Expression) that will be used for filtering the output. The RegExp must be in POSIX extended regular expression syntax:
set service firewall <firewall_name> logging filter <filter>
Note
This filter only applies to the firewall engine logging,
which is always enabled and can be queried using the option engine
in the command service firewall <id> show logging <id>. There is no
filtering for the generated alerts or messages.
The format used by the engine logging is:
%t - <%d> -
which is translated into:
15/10/2010 -- 11:40:07 - <Info> - This is the message shown when logging
Level
Configures the logging level to use when generating engine ouput messages. The following options are available:
debug, for debugging messages (currently not available).
config, for configuration-related messages.
perf, for performance messages.
notice, for more informational messages.
info, for informational messages.
warning, for warning messages.
error, for error-only messages.
The above levels are sorted in such a way that the higher levels always
include the messages from the lower levels. Therefore, for example,
debug will also generate messages with the rest of the levels while
warning will only generate warning and error messages.
Warning
When setting a new configuration, a validator generates
important messages in the system journal. For this, the
firewall must be in notice logging level. If not, the process
may hang up for up to five minutes before being unlocked.
Outputs
Logging outputs define the logging files that are generated for the firewall when analyzing traffic. Such files contain all kinds of information related to the alerts and messages generated by the rules present in the system.
Some outputs contain multiple options, which will be described below.
Fast
Fast format is the most simple and easiest to view, presenting all the relevant information associated with an event in a single line:
10/05/10-10:08:59.667372 [F*] [1:2009187:4] ET WEB_CLIENT CTIVEX iDefense COMRaider ActiveX Control Arbitrary File Deletion [F*] [Classification: Web Application Attack] [Priority: 3] {TCP} xx.xx.232.144:80 F> 192.168.1.4:56068
It can be activated with:
set service firewall <firewall_name> logging outputs fast
HTTP
HTTP format shows detailed information about an HTTP session: the HTTP request itself, hostname, URI and the user-agent:
07/01/2014-04:20:14.338309 vg.no [F*] / [F*] Mozilla/5.0 (Macintosh; Intel Mac OS X 10_9_2) AppleWebKit/537.36 (KHTML, like Gecko) Chrome/35.0.1916.114 Safari/537.36 [F*] 192.168.1.6:64685 F> 195.88.54.16:80
It can be activated with:
set service firewall <firewall_name> logging outputs http
TLS
TLS format is exactly the same as HTTP except that it only registers the parameters used during a TLS handshake.
PCAP
The PCAP registry stores every packet the firewall analyzes during runtime. This is a very aggressive mode as it stores everything the firewall sees (which directly translates into huge files).
This mode can be useful for recording an ongoing or potential attack that you want to reproduce and analyze later. The final PCAP files are stored at:
running://firewall/<firewall_name>/<firewall_name>-log.pcap
By default, every packet is recorded except:
Bypassed packets (either local or capture bypass).
Encrypted flows that are read after key exchange.
It can be activated with:
set service firewall <firewall_name> logging outputs pcap
Verbose
The verbose registry is intended particularly for those attempting to both debug a false-positive and develop their own rules.
It includes lots of information about what is going on and its size increases linearly. It can be activated with:
set service firewall <firewall_name> logging outputs verbose
Syslog
The syslog registry is almost exactly the same as Fast, but instead of dumping the data to a file it goes directly to the system syslog.
The registry has a mandatory parameter called identity to customize
the display name when generating syslog entries. The other parameter,
level, is used to customize the syslog level where messages will be
generated.
Lately, registries can be gathered together and sent to a remote syslog server where their data can be collected and analyzed.
The path is:
set service firewall <firewall_name> logging outputs syslog identity <identifier>
set service firewall <firewall_name> logging outputs syslog level <level>
EVE (Extensible Event Format)
EVE format is a standardized, widely used format with a JSON structure that can be easily moved and used in other platforms. It is the only format that natively supports sending logs to a remote server (in particular, a Redis instance), doing away with the need to perform any kind of local management.
In addition, this format supports all the other formats mentioned above stored in the same place, simplifying how data is managed.
In order to transmit data to a remote Redis server or store it locally, the following configuration must be adjusted:
set service firewall <firewall_name> logging outputs eve filetype <type>
Possible values for <type> are:
redis.
regular(the default).
syslog.
Redis output
When outputting data to a remote Redis server, some of the server-
related fields must be adjusted. While the only required setting is the
key, the rest are usually necessary as well:
The
keydescribes the topic (or channel) that will be used when publishing data. Subsequently, when reading from Redis, this same key must be used to access information.
asyncdefines whether or not the communication with Redis is to be done asynchronously, thereby improving performance but only if the remote server supports it. Defaults totrue.
modedefines how the data will be sent and how to record it on the remote Redis server. There are multiple modes:
list(the default) inserts the data at the beginning of a queue.
channelpublishes the data on a specified channel, working as a pub/sub client.
lpushbehaves exactly the same aslist.
rpushbehaves likelistbut appends the data to the end of the queue.
publishbehaves exactly the same aschannel.
portdefines the numeric port where data will be sent - defaults to6379.
serverdefines the Redis server address to connect to - defaults to127.0.0.1.
As this configuration is very interesting, some Examples will be defined below.
Syslog output
This output behaves exactly the same as Syslog except that the generated
output is in EVE format, i.e., JSON format. It can be configured
with a different identity to the one set in Syslog, making it
possible to apply a filter or gather logs from different sources at a later
time.
Note
This configuration is not explained in detail as it has the same structure and behavior as in Syslog. Please refer to that section for more information.
Rotation
Logging rotation is an add-on to prevent the system filling up with logs generated by the firewall. It is well known that firewall logs tend to use hundreds of gigabytes on a running system (and if Verbose output is enabled, then that value will increase by an order of magnitude), so rotation is a core component (at least when talking about log generation).
Important
Even if nothing is set here, a default configuration runs continuously to ensure files are rotated on a daily basis. It is interesting, though, to adjust both the frequency and size-based rotation depending on the enabled outputs.
Certain parameters can be adjusted:
amountdefines how many rotated log files must be kept. When set to0(the default), no old log file is stored.
compressdefines whether the rotated log files must also be compressed (in this case, using GZIP).
periodicdefines the periodicity for rotating the log files, regardless of size. The following options are available:
hourly(every hour).
daily(every 24 hours, the default).
weekly(every week).
monthly(every month).
yearly(every year).
sizedefines a size-based log file rotation, optionally suffixed with the magnitude. This field supports a simple byte value (size 100), megabytes (size 100M), etc.
The default configuration is:
amount = 0No
compress
periodic = dailyNo
size
Stats
The statistics register useful information about the status of the firewall during operation. The main data collected are packet counters, memory counters and other useful information (related to packets and flows).
Notice that enabling stats will also generate statistics in the EVE logging output.
The path for enabling stats is:
set service firewall <firewall_name> stats <options>
There is an interval configuration option to specify the time interval
(in seconds) for dumping stats.
Important
The interval can be any value. It is important to mention
here that, because of the way the firewall processing units are internally
synchronized, values below 3/4 seconds will not dump stats faster.
Examples
Load-balancing scenario
The usual scenario when starting a firewall is to balance the load across multiple queues. In addition, you need to define where to get the packets. Thus, we want to:
Define a traffic queue with as many queues as logical CPU cores.
Define a traffic policy that enqueues packets into the queues.
Define a basic firewall instance that reads from the queues.
Define the interfaces to read from.
This configuration can be easily achieved with the following commands:
# assuming we have a 4 core processor
set traffic queue Q1 elements 1-4
set traffic policy P1 rule 1 action enqueue Q1
set service firewall F1 ruleset file running://sample.rules
set service firewall F1 mode inline queue Q1
set interfaces ethernet eth0 traffic policy in P1
set interfaces ethernet eth0 traffic policy out P1
Note
Through this example, a sample.rules file will be used
to create the firewall. Said file is simply a placeholder for this
example.
Compressed ruleset
It could happen that a bunch of rules are going to be added to the firewall. An easy way around having to choose each file manually is to define a compressed file with the rules inside and to send this to OSDx for the firewall to use.
First, creating rules in Linux is as simple as:
$ tar czf rules.tgz *.rules
The above command creates a compressed TAR file containing all files
ending with .rules. Then, in OSDx, after fetching
the rules from the device, run:
set service firewall F1 ruleset compressed running://rules.tgz
Tip
If many rules are compressed but you only need one (or a few of them), you can choose the files required for the firewall:
set service firewall F1 ruleset compressed running://rules file rule1.rules
set service firewall F1 ruleset compressed running://rules file rule2.rules
Encrypted ruleset
There may be times when you want to protect rules considered intellectual property. For this, you would need to:
Encrypt a single rule file using AES-256 CBC with PBKDF2, 100000 iterations and
SHA512as derivation algorithm.Configure the firewall to use said file and provide the correct settings for decrypting it.
Creating an encrypted file in Linux is as simple as running:
openssl enc -aes-256-cbc -k "1234567890" -pbkdf2 -iter 1000000 -md sha512 -in rule1.rules -out rule1.aes256
After fetching the file from OSDx, the final configuration looks like this:
set service firewall F1 ruleset file running://rule1.aes256 digest sha512
set service firewall F1 ruleset file running://rule1.aes256 iterations 1000000
set service firewall F1 ruleset file running://rule1.aes256 key-length 256
set service firewall F1 ruleset file running://rule1.aes256 password 1234567890
Applying an encrypted patch
As mentioned in the configuration section, minimal patches can be applied over existing rules. This example shows how to create a patch and then use the commands in the example above to encrypt that patch.
First, we use the GNU diff tool to create the patch:
diff <version1.file> <version2.file> > <output_file>
For this example, let’s imagine that the patch is created from the following files:
diff rules1-2022-09-28.rule rules1-2022-10-05.rule > rules1.patch
openssl enc -aes-256-cbc -k "1234567890" -pbkdf2 -iter 1000000 -md sha512 -in rules1.patch -out rules1.aes256-patch
Important
Notice that rather that two extensions, the encrypted
patch only has aes256-patch. This is because, when extracting
the filename, the “first extension” will be part of the filename,
so there will be no match when comparing against the ruleset.
As an example:
Ruleset name |
Patch name |
Filename comparison |
Match? |
|---|---|---|---|
|
|
|
Yes |
|
|
|
No |
The patch is then encrypted and sent to OSDx, from where it can be applied:
set service firewall F1 ruleset file running://rules1.rule
set service firewall F1 ruleset patch running://rules1.aes256-patch digest sha512
set service firewall F1 ruleset patch running://rules1.aes256-patch iterations 1000000
set service firewall F1 ruleset patch running://rules1.aes256-patch key-length 256
set service firewall F1 ruleset patch running://rules1.aes256-patch password 1234567890
When applying the configuration, the given patch will update the rules
in rules1.rule. In this case, since rules1.rule has the same
contents as rules1-2022-09-28.rule (the origin file when creating
the patch), the operation will update the rules file to rules1-2022-10-05.rule.
However, instead of downloading and overwriting the file again,
only the minimum set of changes are transmitted to update the file.
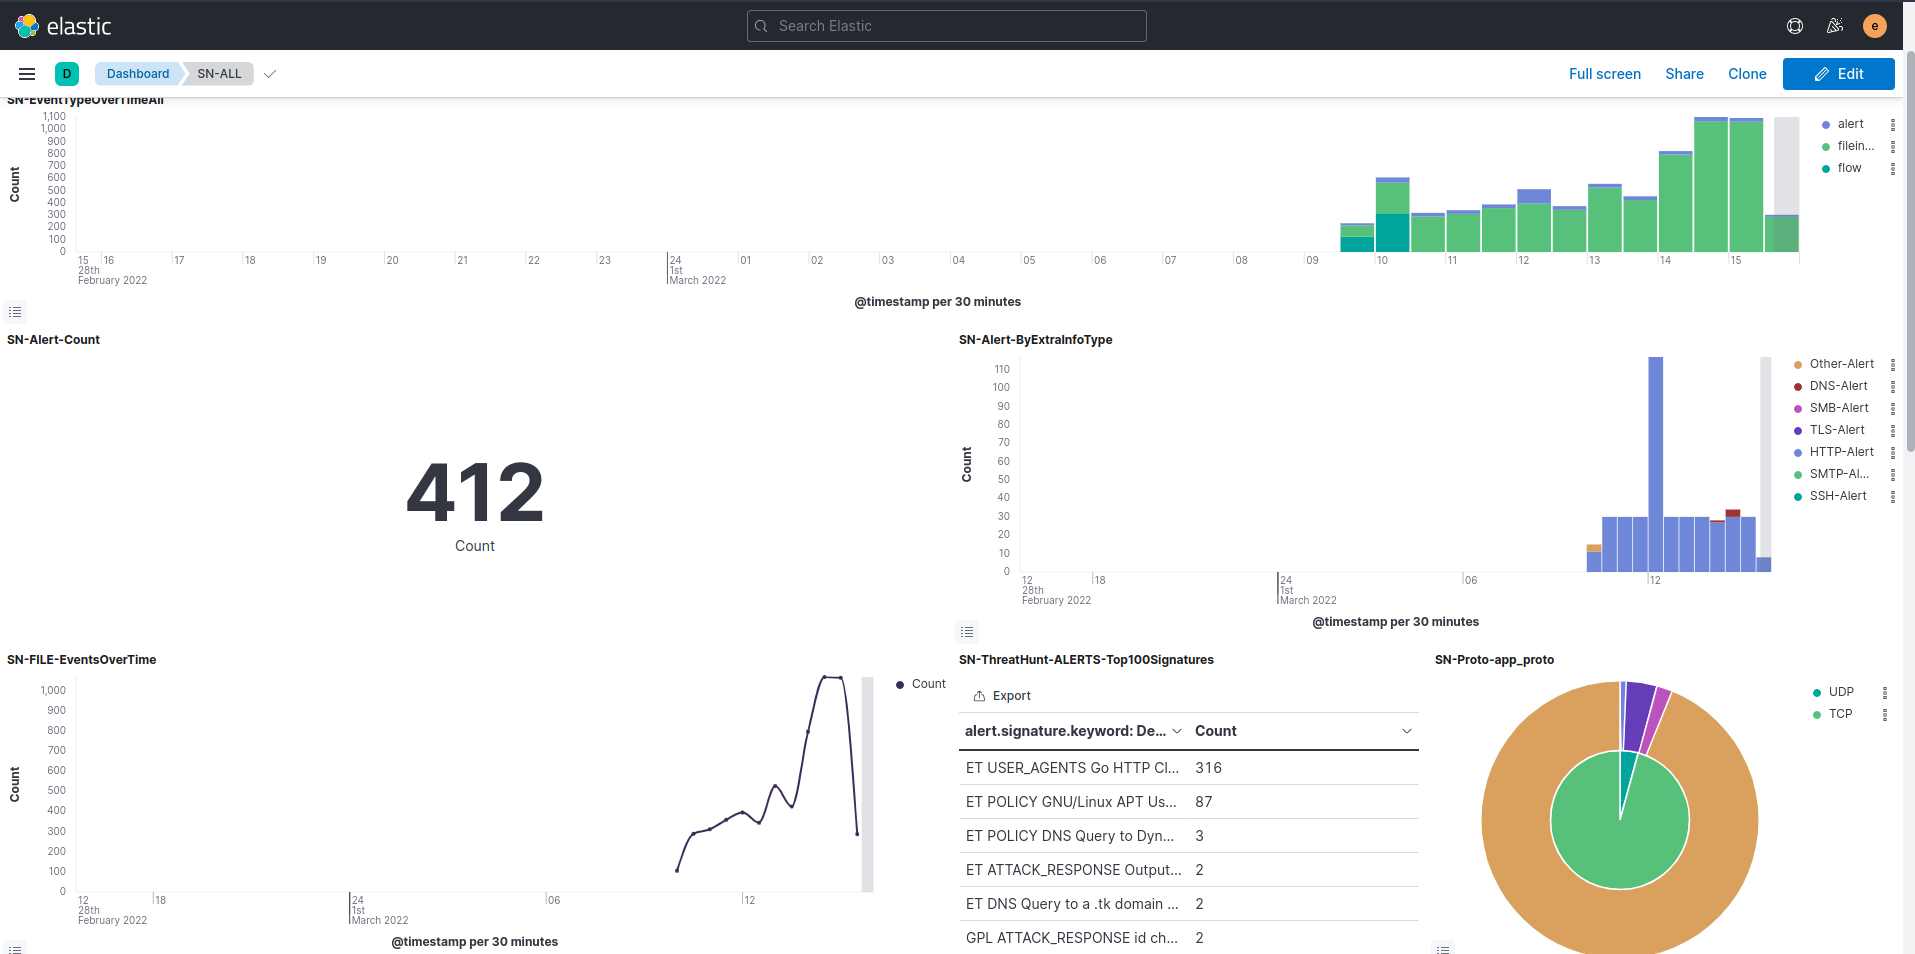
Emitting logs to a remote Redis server
In this example, a Redis instance will be configured and the firewall configuration will be given to emit data to a remote Redis server.
The steps to do this are as follows:
Create a Redis instance that will register the requests.
Configure the firewall to send logs to the remote Redis server.
Demonstrate how logs can be retrieved and displayed using an ELK stack.
To create a Redis server, and simplify the entire process of creating one, start the following Docker container on a remote machine.:
docker run --name redis -d --restart always -p 6379:6379 redis redis-server
Tip
You can define persistence for the container by creating a bind mount. There are also options to save data periodically:
docker run --name redis -d --restart always -v $HOME/redis:/data -p 6379:6379 redis redis-server --save 3600 1 --loglevel warning
After that, the OSDx configuration should be:
set service firewall F1 logging outputs eve filetype redis
set service firewall F1 logging outputs eve redis server <server_ip>
set service firewall F1 logging outputs eve redis key F1-eve
set service firewall F1 logging outputs eve redis mode list
Finally, when setting up an ELK stack, data can be retrieved and presented to the end user in an understandable format:
Emitting logs to a remote syslog server
As with the EVE example, this example demonstrates how to emit logs to a remote syslog server. It will also show you how to deploy a basic syslog server and configure the local logging system (which is OSDx).
In this case, the required steps are:
Configure EVE logging to generate syslog messages. A unique identifier will be used and such messages will be emitted with
noticelog level.Optionally, configure general syslog output for the firewall using a different identifier, so that logs can be gathered differently and other things done.
Set up system syslog to emit such logs to the remote server (let’s say said server is listening at
10.215.168.5).
First of all, Docker will be used to create a syslog-ng server
an open source implementation of the RSyslog protocol. For this, we
use the image created by linuxserver linuxserver/syslog-ng.
Following their recommendations, docker compose will be used
to deploy the server:
docker-compose.yml---
version: "2.1"
services:
syslog-ng:
image: lscr.io/linuxserver/syslog-ng:latest
container_name: syslog-ng
environment:
- PUID=1000
- PGID=1000
- TZ=Europe/Madrid
volumes:
- ${PWD}/config:/config
- ${PWD}/log:/var/log
ports:
- 514:514/udp
- 601:601/tcp
- 6514:6514/tcp
restart: unless-stopped
Important
This file shall be placed in a directory called
rsyslog (we recommend using your home directory). Notice
the ${PWD} in the volumes section: this string shall be
replaced with the directory holding the docker-compose.yml.
Later, a configuration file will need to be defined for the syslog-ng
server. Said file must be placed in config/syslog-ng.conf and, for this
example, its contents will be:
@version: 3.30

log {

source {
    network(transport(tcp) port(601));
};

destination { file("/var/log/syslog-ng.log"); };
};
Finally, the Docker container is started in the background to listen to connections:
sudo docker compose up -d
Tip
If you don’t want to use docker compose, the container can
also be launched directly by issuing:
docker run -d \
    --name=syslog-ng \
    -e PUID=1000 \
    -e PGID=1000 \
    -e TZ=Europe/Madrid \
    -p 514:514/udp \
    -p 601:601/tcp \
    -p 6514:6514/tcp \
    -v ${PWD}/config:/config \
    -v ${PWD}/log:/var/log \
    --restart unless-stopped \
    lscr.io/linuxserver/syslog-ng:latest
The OSDx configuration will then be as follows:
set service firewall F1 logging outputs eve filetype syslog
set service firewall F1 logging outputs eve syslog identity F1-eve
set service firewall F1 logging outputs eve syslog level notice
# This commands are optional and not necessary
set service firewall F1 logging outputs syslog identity F1-general
set service firewall F1 logging outputs syslog level info
# Now, configure the syslog to emit such logs to the remote server
set system syslog host 10.215.168.5 app F1-eve
set system syslog host 10.215.168.5 port 601
set system syslog host 10.215.168.5 protocol tcp
set system syslog host 10.215.168.5 level all
# If the general logs are likely to be emitted also, it is possible
# to configure them too
set system syslog host 10.215.168.5 app F1-general
Note
The syslog logging level needs to be set on the system syslog
path, since by default it will only emit error messages. As both
notice and info logging levels were configured on the firewall
side, all will match both of them.
With the above configuration, firewall messages will be printed to
the system syslog (and can be retrieved with system journal show)
and emitted to a remote syslog server, listening at
10.215.168.5.
On the syslog-ng machine (the one running Docker), received logs can be
checked in the log directory:
cat log/syslog-ng.log
Tip
If no logs are being generated, the communication between OSDx
and the syslog-ng machine may not be working properly.
Review the used IP addresses, configured ports and protocols. The
cause may be related to an issue with the syslog-ng
configuration, so ongoing messages can be checked in
config/log/current.
Setting up multiple logging outputs and rotation
This simple example demonstrates how to set up multiple logging outputs and configure an appropriate rotation for the generated log files.
In particular, the following outputs will be enabled:
fastlogging.
evelogging to a local file.
httplogging.
statsgeneration every 10 seconds.
In addition, the firewall logging engine will be set to notice level.
For this particular configuration, the following rotation will be configured:
Rotate every day and when the generated files are larger than
50 MB.Compress the rotated files.
Keep up to
5old rotated files.
Tip
The rotation configuration also applies to statistics files.
With this in mind, the resulting configuration for OSDx will be:
set service firewall F1 logging level notice
set service firewall F1 logging outputs fast
set service firewall F1 logging outputs eve
set service firewall F1 logging outputs http
set service firewall F1 logging rotation amount 5
set service firewall F1 logging rotation compress
set service firewall F1 logging rotation periodic daily
set service firewall F1 logging rotation size 50M
set service firewall F1 stats interval 10
Configuring local bypass
One of the options available when performing a flow bypass is local
bypass (where the firewall ignores packets – see: Bypass). To
enable the configuration, simply create the bypass node without
any configuration. This enables a default stream bypass whenever
its depth reaches 1MB or for flows whose rules declare the
bypass keyword:
set service firewall <firewall_name> stream bypass
For demonstration purposes, this example defines a different depth.
In particular, the streams that should be bypassed must have
a depth of at least 512KB:
set service firewall F1 stream bypass depth 512KB
Tip
The depth value can optionally contain the magnitude. This
magnitude is case insensitive, i.e., it can be written in both
lowercase and uppercase letters. If no magnitude is defined, the
value is assumed to be in bytes.
Configuring capture bypass + traffic offload
The following is an advanced example showing how to configure a generic capture bypass and how to offload traffic to the system offload engine.
The first task will prevent packets reaching the firewall and going to userspace (which consumes a lot of resources). The second task will further improve performance by redirecting traffic to the outgoing interface once its tuple has been annotated.
Note
With this configuration, even if traffic cannot be offloaded, there is still a performance gain for flows deemed safe or that have reached maximum depth.
While most traffic can be offloaded (thus preventing it from reaching the firewall), some protocols and applications do not allow traffic to be offloaded. For such situations, the capture bypass should be configured too.
Perform the following actions to configure it:
Decide which
markto set to avoid the firewall. Packets with thismarkwill not be enqueued and therefore will not reach the firewall. This example uses a connmarkmark.Configure a load balancing Traffic Queue.
Configure a Traffic Selector that selects only those packets that do not have the chosen mark.
Configure a Traffic Policy that enqueues those packets that comply with the traffic selector just defined in the configured queue.
Configure a simple firewall instance that contains a rule for bypassing traffic. This example bypasses SSH traffic.
Enable the firewall bypass feature, setting both the
markand the offload flag.
Firstly, the mark that will be used is 0xAF (or 175 decimal)
and the mask 0xFFFFFFFF (or 4294967295 decimal). Then the
Traffic Selector is created with the rest
of the traffic items:
set traffic queue FW_Q elements 1-4
set traffic selector NOT-BYPASSED rule 1 not connmark 175
set traffic policy FW_POL rule 1 action enqueue FW_Q
set traffic policy FW_POL rule 1 selector NOT-BYPASSED
Secondly, the firewall is configured. The rule to bypass SSH
traffic is simple, just define a rule that generates an alert
(so that you know when there is a match) containing the
bypass keyword:
alert ssh any any -> any any (msg:"Established SSH connection - triggering bypass"; flow:established, to_server; bypass; sid:1000000;)
Note
The rule has some other options, like flow and sid.
The first of these tells the rule engine to only trigger the rule
when the flow (in this case, the SSH session) has been established
and it was an incoming connection. The sid is simply an identifier
for the rule to prevent duplicate rules (rules with the same sid)
from coexisting.
With the rule defined, the firewall configuration is:
set service firewall F1 mode inline queue FW_Q
set service firewall F1 ruleset file running://bypass.rule
set service firewall F1 logging outputs fast
set service firewall F1 stream bypass mark 175
set service firewall F1 stream bypass mask 4294967295
set service firewall F1 stream bypass set-connmark
set service firewall F1 stream bypass action accept set conntrack offload-flag
As can be seen, fast output was also configured. This allows
you to see if the incoming SSH traffic has been correctly identified.
Finally, the interface must be configured:
set interfaces ethernet eth0 traffic policy in FW_POL
set interfaces ethernet eth0 traffic policy out FW_POL
Note
The traffic policy was configured for incoming and outgoing packets so the bypass would be able to identify responses to existing connections.
Once configured, opening an SSH connection should trigger an alert in the
fast logs and mark the flow as offloadable:
08/09/2022-08:16:15.000268 [**] [1:1000000:0] Established SSH connection - triggering bypass [**] [Classification: (null)] [Priority: 3] {TCP} 192.168.122.1:36318 -> 192.168.122.120:22
Tip
To find out whether the offloading is working properly, you can dump the existing conntrack sessions from within the operational menu:
system conntrack show
This example can be broaden by also configuring a generic capture bypass-drop to prevent packets belonging to dropped flows from reaching the firewall.
The mark that will be used to identify dropped pakets is 0xE3 (or 227
decimal). Create another Traffic Selector for
traffic identified to be dropped and modify the rest of the traffic items:
set traffic selector BYPASS-DROP rule 1 connmark 227
set traffic policy FW_POL rule 1 action drop
set traffic policy FW_POL rule 1 selector BYPASS-DROP
set traffic policy FW_POL rule 2 action enqueue FW_Q
set traffic policy FW_POL rule 2 selector NOT-BYPASSED
Add the following configuration to the firewall:
set service firewall F1 bypass action drop set connmark mark 227
Advanced features
Selectors
Rule selectors are one of the most powerful features in the firewall. They allow rules to specifically match traffic, despite it being enqueued in the same queue.
One of the main uses for this selector is to have like multiple rulesets that perform actions based on incoming traffic. With this in mind, one could classify traffic, enqueue it and then the firewall rules will only be applied to the traffic matching the selector.
The selectors use Traffic Label to classify
traffic. These labels are simply human-readable strings that mark incoming
traffic so other applications can know more about said traffic. Once
defined, all applications in the system can access them and determine
which packets have one or more labels set. Currently, a maximum
of 128 labels can be defined.
When talking about the firewall, labels are used to decide which rules
to apply to which packets. This is done with the selector keyword,
which is defined just like any other keyword in the rules. Its syntax
is:
selector: <labels>;
where <labels> can be a single label or a comma-separated list of
labels.
Let’s demonstrate its behavior through an example. A firewall is set as an edge device forwarding traffic to a cloud from the Internet. A bunch of rules protect the system against intrusion, though some of the rules are less restrictive because the traffic is known to be good.
The rules in the system have the following characteristics:
There are rules for only performing
IDS.There are rules for only performing
IPS.There are rules for detecting
MALWARE.There are rules that can combine the behaviors above.
One possible approach could be to have multiple firewall instances
reading each one from a queue, and to create multiple traffic
selectors that enqueue traffic into different queues depending
on the source. Nevertheless, selectors are much simpler (allowing
you to apply a rule to multiple traffic sources) and use far fewer
resources.
Firstly, the labels must be created:
set traffic label IDS
set traffic label IPS
set traffic label MALWARE
Next, the traffic needs to be filtered. Traffic from the local LAN
(192.168.122.0/24 and 192.168.1.0/24) will only be checked
for IDS. Then, traffic from the VPN LAN (10.0.0.0/16) will
be checked for IPS. Finally, the rest of the traffic (0.0.0.0/0
except the two already mentioned) will be checked against IDS,
IPS and MALWARE. The traffic configuration will look like
this:
set traffic queue FW_Q elements 1-4
set traffic selector LAN rule 1 source address 192.168.122.0/24
set traffic selector LAN rule 2 source address 192.168.1.0/24
set traffic selector VPN rule 1 source address 10.0.0.0/16
set traffic selector WAN rule 1 not source address 192.168.122.0/24
set traffic selector WAN rule 2 not source address 192.168.1.0/24
set traffic selector WAN rule 3 not source address 10.0.0.0/16
set traffic selector NOT-BYPASSED rule 1 not connmark 175
set traffic policy EDGE description 'Firewall edge detection policy'
set traffic policy EDGE rule 1 selector NOT-BYPASSED
set traffic policy EDGE rule 1 action continue
set traffic policy EDGE rule 2 action enqueue FW_Q
set traffic policy EDGE rule 2 selector LAN
set traffic policy EDGE rule 2 set label IDS
set traffic policy EDGE rule 3 action enqueue FW_Q
set traffic policy EDGE rule 3 selector VPN
set traffic policy EDGE rule 3 set label IPS
set traffic policy EDGE rule 4 action continue
set traffic policy EDGE rule 4 selector WAN
set traffic policy EDGE rule 4 set label IDS
set traffic policy EDGE rule 5 action continue
set traffic policy EDGE rule 5 set label IPS
set traffic policy EDGE rule 6 action enqueue FW_Q
set traffic policy EDGE rule 6 set label MALWARE
The configuration shown above defines multiple selectors (for which
all rules must be true) and then a traffic policy with multiple rules.
When a traffic policy matches a packet (and its action is a terminator
action, in this case, enqueue), it skips the rest of the rules and
finishes. As we also want the
capture bypass
feature to be active, there is an additional selector that skips traffic
marked to be bypassed. If traffic has no matching mark then the rest of
the rules are evaluated.
As rule 3 has the WAN selector, we know that traffic reaching that
point must have all three labels. For that use case, the rules are more
permissive and continue to the next one, adding the expected labels,
until the packet must be enqueued.
Next, a firewall ruleset matching the labeled traffic must be defined The following ruleset will be used:
alert ssh any any -> any any (msg:"IDS SSH connection"; flow:established, to_server; bypass; selector: IDS; sid:1000000;)
alert ssh any any -> any any (msg:"IPS SSH connection"; flow:established, to_server; selector: IPS; sid:1000001;)
drop ip any any -> any any (msg:"IPS/MALWARE GPL ATTACK_RESPONSE id check returned root"; content:"uid=0|28|root|29|"; classtype:bad-unknown; sid:2100498; rev:7; metadata:created_at 2010_09_23, updated_at 2010_09_23; selector: IPS, MALWARE;)
alert ip any any -> any any (msg:"IDS GPL ATTACK_RESPONSE id check returned root"; content:"uid=0|28|root|29|"; classtype:bad-unknown; sid:2100499; rev:7; metadata:created_at 2010_09_23, updated_at 2010_09_23; selector: IDS;)
pass icmp any any -> any any (sid: 1234567890;)
The selector works as follows:
If the rule has no
selectordefined, it matches all traffic.If the rule has a
selector, it prefilters traffic and skips all rules whose label(s) does not match incoming packet labels.If a packet matches a rule with a
selector, then the rule is triggered as usual.
For the rules defined above, there is one global rule that will match
all traffic (the ICMP one) and the rest of the rules will match
packets whose label is in the list of selected labels.
Important
Packets without labels are never matched against a rule that contains a selector.
Thus, the firewall configuration will look like this:
set service firewall F1 ruleset file running://selector.rules
set service firewall F1 mode inline queue FW_Q
set service firewall F1 logging outputs fast
set service firewall F1 stream bypass mark 175
set service firewall F1 stream bypass mask 4294967295
set service firewall F1 stream bypass set-connmark
set service firewall F1 stream bypass action accept set conntrack offload-flag
Finally, the traffic policy must be applied to both the incoming and ougoing interfaces:
set interfaces ethernet eth0 traffic policy in EDGE
set interfaces ethernet eth1 traffic policy in EDGE
Traffic early drop information
When using the Traffic early drop feature, it is sometimes interesting to see how many packets are being dropped and how said feature is behaving. There is an operational command (not one of those belonging to the firewall) that allows you to see some XDP statistics.
First, for demonstration purposes, let’s configure the firewall with the
following rule to drop all traffic going to port 5000:
drop tcp any any -> any 5000 (msg: "Dropping traffic to port 5000"; sid: 1000000; flow:established, to_server;)
Important
The XDP early drop feature is currently only working for IPv4 and IPv6 TCP or UDP transmissions – it won’t work for other protocols.
Next, the minimal firewall configuration to make it work is:
set traffic queue Q1 elements 1
set traffic policy P1 rule 1 action enqueue Q1
set service firewall F1 ruleset file running://icmp.drop
set service firewall F1 mode inline queue Q1
set service firewall F1 logging outputs fast
set service firewall F1 stream bypass action drop set xdp-early-drop eth0
set interfaces ethernet eth0 traffic policy in P1
set interfaces ethernet eth0 traffic policy out P1
After that, it is as simple as starting a monitor test performance server
running on port 5000 and then a client that connects to that server,
by running monitor test performance client <ipv4|ipv6|txt> port <u32>. You
will notice that traffic reaches the server but when the performance
test starts it is dropped:
[  4] local 192.168.122.120 port 5000 connected with 192.168.122.133 port 41852
###############################################################################
##################################### ON CLIENT ###############################
###############################################################################
------------------------------------------------------------
Client connecting to 192.168.122.120, TCP port 5000
TCP window size: 85.0 KByte (default)
------------------------------------------------------------
[  3] local 192.168.122.133 port 41852 connected with 192.168.122.120 port 5000
[ ID] Interval       Transfer     Bandwidth
[  3]  0.0-10.1 sec   107 KBytes  86.9 Kbits/sec
If interfaces ethernet <value> monitor xdp-stats is run on the machine acting as
server, the XDP_DROP action increases with every transmission attempt
made:
Period of 1.000137s ending at 1660045960.972531
XDP_DROP             942 pkts (         0 pps)        1386 KiB (     0 Mbits/s)
XDP_PASS         9069355 pkts (         0 pps)    13399783 KiB (     0 Mbits/s)
Tip
If the port is left unchanged, running the interfaces ethernet <value> monitor xdp-stats
command will show that a lot of packets are passing through the
XDP_ACCEPT action, meaning that the XDP filter is active but
such packets are being accepted (because by default the port to
use is port 5001).
Monitoring commands
The firewall has multiple monitoring commands: some to show information about the firewall itself (such as operations against the service) and others to retrieve information about firewall alerts.
Service
There are a bunch of commands to manage the firewall service. They are available under path:
service firewall <firewall_name> <operation>
The available operations are:
reload-rulesis a simple, fast operation that reloads rules for the firewall client without having to restart it, so disruption is minimal. This is ideal after downloading new rules (with the same name) that the firewall needs to know about.
replayinstructs the firewall to replay a PCAP file using the configured rules. This operation is very useful when trying to identify false positives or just trying out a bunch of rules. See the Replay section for a more detailed explanation.
restartCompletely restarts the firewall, as if a configuration change had been made. This operation is very expensive in terms of time and resources and must only be used if an unexpected error occurs during firewall operation.
statusshows the current status of the firewall service, indicating if it is up and running or if an error has occurred. It accepts anextendedparameter that shows information directly obtained from SystemD without parsing.
showandmonitor. Both display useful information aboutfirewall status, events occurring and more. See the Show and monitor section for a detailed description.
Replay
The replay feature takes one or more PCAP files and instructs the firewall to reproduce them, as if it was analyzing the traffic registered by those PCAPs.
There is no restriction on the type of PCAP files: they can be obtained from the Internet, captured with Wireshark or PCAP files generated by a firewall instance during normal firewall operation (when PCAP output is enabled). The firewall will generate the corresponding alerts for the replayed file. These will be archived and compressed so they can be reviewed later.
Warning
Replaying a PCAP file will interrupt the firewall’s operation – there will be no network processing during this time. If the firewall has been configured to read from a queue, all packets will remain there until the operation is done.
The command can be invoked with:
service firewall <firewall_name> replay <path> <options>
Tip
If <path> is a directory, all PCAP files in the directory will
be replayed one after each other.
The following options accept the replay feature:
force, when invoking from a non-interactive shell, to perform a replay without asking any questions.
leveldefines the logging level of messages written into the syslog that may contain useful information when an error occurs.
quietdisplays no message to the console.
verbosedisplays lots of information about the communication against the firewall instance.
Show and monitor
The show and monitor commands display useful information about
either the firewall itself or about the generated alerts. They are
available under the following path:
service firewall <firewall_name> monitor/show <options>
and display information about:
logging, which shows logging information about the enabled outputs or theengineitself (which is always available). Certain informational messages are useful when querying the logs:
If the not enabled logging output is chosen, an error message will appear to notify you about this issue:
admin@osdx$ service firewall <firewall_name> show logging http
Firewall client "<firewall_name>" does not define "http" logging output
If an output doesn’t have any contents yet, a message will be displayed notifying you of this (note: this only applies for the
showcommand):admin@osdx$ service firewall <firewall_name> show logging fast No fast logs yet for client "<firewall_name>"If EVE output is enabled but logs are forwarded to a remote Redis server, trying to access the logs will display a message informing you of this:
admin@osdx$ service firewall <firewall_name> show logging eve
EVE registries are being logged to redis@<redis_address>
queuesdisplays information about the Netfilter queues where packets are being enqueued. The output has the following format:Legend ------ # - Queue number PPort - Peer Port ID WP - Current number of Waiting Packets CM - Copy Mode: 0/1 only headers will be included; 2 will copy the entire packet CR - Copy Range: length of packet data to put in message QDP - Queue Dropped Packets UDP - User Dropped Packets SID - Sequence ID -------------------------------------- # PPort WP CM CR QDP UDP SID -------------------------------------- 1 2813 0 2 65531 0 0 26
statsshow statistics about the firewall and the analyzed flows. This is only available if Stats has been previously enabled in the configuration.
XDP stats
While this command is not directly associated with the firewall, it allows you to gather information about the XDP filter when the early-drop feature is enabled.
The command for querying XDP statistics is available under path:
:osdx:op:`interfaces ethernet * monitor xdp-stats`
Note
XDP statistics are per-interface, so you need to know which interface the firewall is reading from.
The output will show already used XDP actions alongside useful information, such as currently affected packets, packets per second, total size of affected packets and megabits per second for the action. The expected output is:
Period of 1.001713s ending at 1660048330.002979
XDP_DROP             942 pkts (         0 pps)        1386 KiB (     0 Mbits/s)
XDP_PASS         9070551 pkts (         1 pps)    13399845 KiB (     0 Mbits/s)
It also supports an interval option, which allows you to define
the query speed in milliseconds (by default, it queries every second).
A second option, times, delimits how many times stats should be
queried. If this option is 0 (the default), then stats are queried
forever.