Bypass Tests
The following scenario shows different configuration alternatives to improve the OSDx firewall performance.
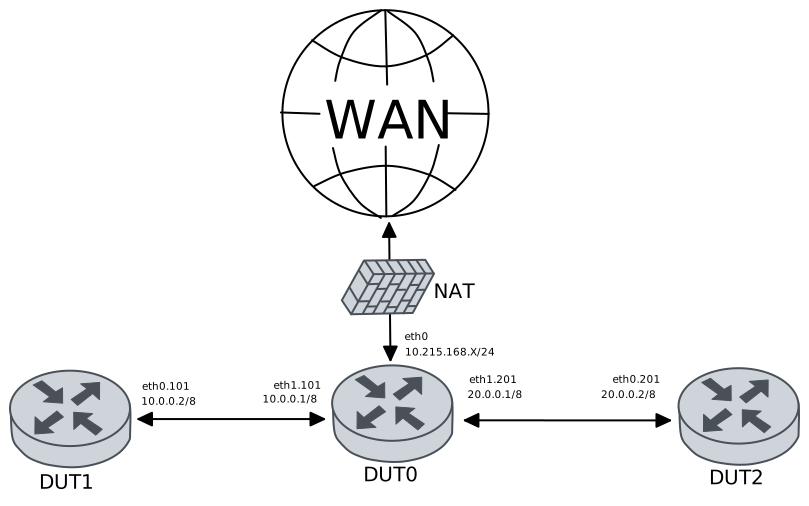
Test Local Bypass
Description
Builds a scenario with three DUTs in which a performance test is carried out between DUT1 and DUT2, and DUT0 is the router running the firewall. “Local bypass” is set to allow the firewall to internally skips packets belonging to a flow that must be bypassed. The performance test may produce better results than the general tests.
Scenario
Step 1: Run the command file copy http://10.215.168.1/~robot/test-performance.rules running:// force on DUT0 and expect the following output:
Show output
  % Total    % Received % Xferd  Average Speed   Time    Time     Time  Current
                                 Dload  Upload   Total   Spent    Left  Speed
100   266  100   266    0     0  40666      0 --:--:-- --:--:-- --:--:-- 44333
Step 2: Run the command file show running://test-performance.rules on DUT0 and expect the following output:
Show output
alert tcp any any -> any 5001 (msg: "Skipping test network performance TCP traffic"; bypass; flow: established, to_server; sid: 40;)
alert udp any any -> any 5001 (msg: "Skipping test network performance UDP traffic"; bypass; flow: established, to_server; sid: 41;)
Step 3: Set the following configuration in DUT0 :
set interfaces ethernet eth0 address 10.215.168.64/24
set interfaces ethernet eth0 traffic nat source rule 1 address masquerade
set interfaces ethernet eth1 vif 101 address 40.0.0.1/8
set interfaces ethernet eth1 vif 101 traffic policy in FW_PLAN
set interfaces ethernet eth1 vif 201 address 20.0.0.1/8
set interfaces ethernet eth1 vif 201 traffic policy in FW_PLAN
set protocols static route 0.0.0.0/0 next-hop 10.215.168.1
set service dns static host-name WAN inet 10.215.168.1
set service firewall FW logging level config
set service firewall FW logging outputs fast
set service firewall FW mode inline queue FW_Q
set service firewall FW ruleset file 'running://test-performance.rules'
set service firewall FW stream bypass
set service firewall FW validator-timeout 20
set system login user admin authentication encrypted-password '$6$GSjsCj8gHLv$/VcqU6FLi6CT2Oxn0MJQ2C2tqnRDrYKNF8HIYWJp68nvXvPdFccDsT04.WtigUONbKYrgKg8d6rEs8PjljMkH0'
set traffic policy FW_PLAN rule 1 action enqueue FW_Q
set traffic queue FW_Q elements 1
Step 4: Ping the IP address 40.0.0.2 from DUT0:
admin@DUT0$ ping 40.0.0.2 count 1 size 56 timeout 1Show output
PING 40.0.0.2 (40.0.0.2) 56(84) bytes of data.
64 bytes from 40.0.0.2: icmp_seq=1 ttl=64 time=0.247 ms

--- 40.0.0.2 ping statistics ---
1 packets transmitted, 1 received, 0% packet loss, time 0ms
rtt min/avg/max/mdev = 0.247/0.247/0.247/0.000 ms
Step 5: Ping the IP address 20.0.0.2 from DUT0:
admin@DUT0$ ping 20.0.0.2 count 1 size 56 timeout 1Show output
PING 20.0.0.2 (20.0.0.2) 56(84) bytes of data.
64 bytes from 20.0.0.2: icmp_seq=1 ttl=64 time=0.499 ms

--- 20.0.0.2 ping statistics ---
1 packets transmitted, 1 received, 0% packet loss, time 0ms
rtt min/avg/max/mdev = 0.499/0.499/0.499/0.000 ms
Step 6: Ping the IP address 20.0.0.2 from DUT1:
admin@DUT1$ ping 20.0.0.2 count 1 size 56 timeout 1Show output
PING 20.0.0.2 (20.0.0.2) 56(84) bytes of data.
64 bytes from 20.0.0.2: icmp_seq=1 ttl=63 time=0.563 ms

--- 20.0.0.2 ping statistics ---
1 packets transmitted, 1 received, 0% packet loss, time 0ms
rtt min/avg/max/mdev = 0.563/0.563/0.563/0.000 ms
Step 7: Ping the IP address 40.0.0.2 from DUT2:
admin@DUT2$ ping 40.0.0.2 count 1 size 56 timeout 1Show output
PING 40.0.0.2 (40.0.0.2) 56(84) bytes of data.
64 bytes from 40.0.0.2: icmp_seq=1 ttl=63 time=0.537 ms

--- 40.0.0.2 ping statistics ---
1 packets transmitted, 1 received, 0% packet loss, time 0ms
rtt min/avg/max/mdev = 0.537/0.537/0.537/0.000 ms
Step 8: Initiate a bandwidth test from DUT2 to DUT1
admin@DUT1$ monitor test performance server port 5001
admin@DUT2$ monitor test performance client 40.0.0.2 duration 10 port 5001 parallel 1
Expect the following output on
DUT2:Connecting to host 40.0.0.2, port 5001 [ 5] local 20.0.0.2 port 47182 connected to 40.0.0.2 port 5001 [ ID] Interval Transfer Bitrate Retr Cwnd [ 5] 0.00-1.00 sec 148 MBytes 1.24 Gbits/sec 0 1.60 MBytes [ 5] 1.00-2.00 sec 112 MBytes 944 Mbits/sec 0 1.60 MBytes [ 5] 2.00-3.00 sec 102 MBytes 860 Mbits/sec 0 1.60 MBytes [ 5] 3.00-4.00 sec 121 MBytes 1.02 Gbits/sec 0 1.60 MBytes [ 5] 4.00-5.00 sec 125 MBytes 1.05 Gbits/sec 0 1.60 MBytes [ 5] 5.00-6.00 sec 118 MBytes 986 Mbits/sec 0 1.60 MBytes [ 5] 6.00-7.00 sec 136 MBytes 1.14 Gbits/sec 15 1.20 MBytes [ 5] 7.00-8.00 sec 93.8 MBytes 786 Mbits/sec 0 1.32 MBytes [ 5] 8.00-9.00 sec 131 MBytes 1.10 Gbits/sec 0 1.41 MBytes [ 5] 9.00-10.00 sec 145 MBytes 1.22 Gbits/sec 0 1.48 MBytes - - - - - - - - - - - - - - - - - - - - - - - - - [ ID] Interval Transfer Bitrate Retr [ 5] 0.00-10.00 sec 1.20 GBytes 1.03 Gbits/sec 15 sender [ 5] 0.00-10.01 sec 1.20 GBytes 1.03 Gbits/sec receiver iperf Done.
Step 9: Run the command service firewall FW show logging fast | tail on DUT0 and check whether the output matches the following regular expressions:
(?m)^.+(Skipping test network performance TCP traffic).+$Show output
07/24/2026-10:03:39.399745  [**] [1:40:0] Skipping test network performance TCP traffic [**] [Classification: (null)] [Priority: 3] {TCP} 20.0.0.2:47174 -> 40.0.0.2:5001
07/24/2026-10:03:39.400911  [**] [1:40:0] Skipping test network performance TCP traffic [**] [Classification: (null)] [Priority: 3] {TCP} 20.0.0.2:47182 -> 40.0.0.2:5001
Test Capture Bypass Using Packet Mark
Description
Builds a scenario with three DUTs in which a performance test is conducted between DUT1 and DUT2, and DUT0 is the router running the firewall. “Capture bypass” is set to allow the firewall to mark packets. An external tool can then decide what to do with the flow when the mark is seen. For this example, when packet marks are detected, the traffic is assigned a label, thereby allowing the possibility of classifying traffic. In particular, labeling avoids traffic from entering the firewall.
Performance must improve considerably compared to the Local Bypass test.
The test is extended by using other packet marks that we have customized for the firewall.
Scenario
Step 1: Run the command file copy http://10.215.168.1/~robot/test-performance.rules running:// force on DUT0 and expect the following output:
Show output
  % Total    % Received % Xferd  Average Speed   Time    Time     Time  Current
                                 Dload  Upload   Total   Spent    Left  Speed
100   266  100   266    0     0  90692      0 --:--:-- --:--:-- --:--:--  129k
Step 2: Run the command file show running://test-performance.rules on DUT0 and expect the following output:
Show output
alert tcp any any -> any 5001 (msg: "Skipping test network performance TCP traffic"; bypass; flow: established, to_server; sid: 40;)
alert udp any any -> any 5001 (msg: "Skipping test network performance UDP traffic"; bypass; flow: established, to_server; sid: 41;)
Step 3: Set the following configuration in DUT0 :
set interfaces ethernet eth0 address 10.215.168.64/24
set interfaces ethernet eth0 traffic nat source rule 1 address masquerade
set interfaces ethernet eth1 vif 101 address 40.0.0.1/8
set interfaces ethernet eth1 vif 101 traffic policy in FW_PLAN
set interfaces ethernet eth1 vif 101 traffic policy out FW-SKIP
set interfaces ethernet eth1 vif 201 address 20.0.0.1/8
set interfaces ethernet eth1 vif 201 traffic policy in FW_PLAN
set interfaces ethernet eth1 vif 201 traffic policy out FW-SKIP
set protocols static route 0.0.0.0/0 next-hop 10.215.168.1
set service dns static host-name WAN inet 10.215.168.1
set service firewall FW logging level config
set service firewall FW logging outputs fast
set service firewall FW mode inline queue FW_Q
set service firewall FW ruleset file 'running://test-performance.rules'
set service firewall FW stream bypass mark 129834765
set service firewall FW stream bypass mask 129834765
set service firewall FW validator-timeout 20
set system login user admin authentication encrypted-password '$6$GSjsCj8gHLv$/VcqU6FLi6CT2Oxn0MJQ2C2tqnRDrYKNF8HIYWJp68nvXvPdFccDsT04.WtigUONbKYrgKg8d6rEs8PjljMkH0'
set traffic label BYPASS
set traffic policy FW-SKIP rule 1 log prefix SKIP
set traffic policy FW-SKIP rule 1 selector MARKED-PACKETS
set traffic policy FW-SKIP rule 1 set label BYPASS
set traffic policy FW_PLAN rule 1 action enqueue FW_Q
set traffic policy FW_PLAN rule 1 selector FW_SEL_ENQUEUE
set traffic queue FW_Q elements 1
set traffic selector FW_SEL_ENQUEUE rule 1 not label BYPASS
set traffic selector MARKED-PACKETS rule 1 mark 129834765
Step 4: Ping the IP address 40.0.0.2 from DUT0:
admin@DUT0$ ping 40.0.0.2 count 1 size 56 timeout 1Show output
PING 40.0.0.2 (40.0.0.2) 56(84) bytes of data.
64 bytes from 40.0.0.2: icmp_seq=1 ttl=64 time=0.395 ms

--- 40.0.0.2 ping statistics ---
1 packets transmitted, 1 received, 0% packet loss, time 0ms
rtt min/avg/max/mdev = 0.395/0.395/0.395/0.000 ms
Step 5: Ping the IP address 20.0.0.2 from DUT0:
admin@DUT0$ ping 20.0.0.2 count 1 size 56 timeout 1Show output
PING 20.0.0.2 (20.0.0.2) 56(84) bytes of data.
64 bytes from 20.0.0.2: icmp_seq=1 ttl=64 time=0.399 ms

--- 20.0.0.2 ping statistics ---
1 packets transmitted, 1 received, 0% packet loss, time 0ms
rtt min/avg/max/mdev = 0.399/0.399/0.399/0.000 ms
Step 6: Ping the IP address 20.0.0.2 from DUT1:
admin@DUT1$ ping 20.0.0.2 count 1 size 56 timeout 1Show output
PING 20.0.0.2 (20.0.0.2) 56(84) bytes of data.
64 bytes from 20.0.0.2: icmp_seq=1 ttl=63 time=0.594 ms

--- 20.0.0.2 ping statistics ---
1 packets transmitted, 1 received, 0% packet loss, time 0ms
rtt min/avg/max/mdev = 0.594/0.594/0.594/0.000 ms
Step 7: Ping the IP address 40.0.0.2 from DUT2:
admin@DUT2$ ping 40.0.0.2 count 1 size 56 timeout 1Show output
PING 40.0.0.2 (40.0.0.2) 56(84) bytes of data.
64 bytes from 40.0.0.2: icmp_seq=1 ttl=63 time=0.599 ms

--- 40.0.0.2 ping statistics ---
1 packets transmitted, 1 received, 0% packet loss, time 0ms
rtt min/avg/max/mdev = 0.599/0.599/0.599/0.000 ms
Step 8: Initiate a bandwidth test from DUT2 to DUT1
admin@DUT1$ monitor test performance server port 5001
admin@DUT2$ monitor test performance client 40.0.0.2 duration 10 port 5001 parallel 1
Expect the following output on
DUT2:Connecting to host 40.0.0.2, port 5001 [ 5] local 20.0.0.2 port 40562 connected to 40.0.0.2 port 5001 [ ID] Interval Transfer Bitrate Retr Cwnd [ 5] 0.00-1.00 sec 249 MBytes 2.09 Gbits/sec 0 1.55 MBytes [ 5] 1.00-2.00 sec 252 MBytes 2.12 Gbits/sec 0 1.55 MBytes [ 5] 2.00-3.00 sec 256 MBytes 2.15 Gbits/sec 0 1.55 MBytes [ 5] 3.00-4.00 sec 235 MBytes 1.97 Gbits/sec 0 1.55 MBytes [ 5] 4.00-5.00 sec 250 MBytes 2.10 Gbits/sec 0 1.55 MBytes [ 5] 5.00-6.00 sec 198 MBytes 1.66 Gbits/sec 0 1.55 MBytes [ 5] 6.00-7.00 sec 234 MBytes 1.96 Gbits/sec 34 1.16 MBytes [ 5] 7.00-8.00 sec 93.8 MBytes 786 Mbits/sec 1 1.41 KBytes [ 5] 8.00-9.00 sec 0.00 Bytes 0.00 bits/sec 1 1.41 KBytes [ 5] 9.00-10.00 sec 0.00 Bytes 0.00 bits/sec 1 1.25 MBytes - - - - - - - - - - - - - - - - - - - - - - - - - [ ID] Interval Transfer Bitrate Retr [ 5] 0.00-10.00 sec 1.73 GBytes 1.48 Gbits/sec 37 sender [ 5] 0.00-10.00 sec 1.72 GBytes 1.48 Gbits/sec receiver iperf Done.
Step 9: Run the command service firewall FW show logging fast | tail on DUT0 and check whether the output matches the following regular expressions:
(?m)^.+(Skipping test network performance TCP traffic).+$Show output
07/24/2026-10:04:19.961496  [**] [1:40:0] Skipping test network performance TCP traffic [**] [Classification: (null)] [Priority: 3] {TCP} 20.0.0.2:40546 -> 40.0.0.2:5001
07/24/2026-10:04:19.962527  [**] [1:40:0] Skipping test network performance TCP traffic [**] [Classification: (null)] [Priority: 3] {TCP} 20.0.0.2:40562 -> 40.0.0.2:5001
Step 10: Run the command system journal show | cat on DUT0 and check whether the output matches the following regular expressions:
(?m)^.*\[SKIP\-1\].*$Show output
Jul 24 10:04:10.000115 osdx systemd[1]: Started systemd-timedated.service - Time & Date Service.
Jul 24 10:04:10.000273 osdx systemd-timedated[397241]: Changed local time to Fri 2026-07-24 10:04:10 UTC
Jul 24 10:04:10.002694 osdx OSDxCLI[396728]: User 'admin' executed a new command: 'set date 2026-07-24 10:04:10'.
Jul 24 10:04:10.004088 osdx systemd-journald[2180]: Time jumped backwards, rotating.
Jul 24 10:04:10.374770 osdx systemd-journald[2180]: Runtime Journal (/run/log/journal/3a8dbab828fc40a183893e468c03e10b) is 1.9M, max 13.8M, 11.9M free.
Jul 24 10:04:10.376097 osdx systemd-journald[2180]: Received client request to rotate journal, rotating.
Jul 24 10:04:10.376160 osdx systemd-journald[2180]: Vacuuming done, freed 0B of archived journals from /run/log/journal/3a8dbab828fc40a183893e468c03e10b.
Jul 24 10:04:10.394042 osdx OSDxCLI[396728]: User 'admin' executed a new command: 'system journal clear'.
Jul 24 10:04:10.685016 osdx OSDxCLI[396728]: User 'admin' executed a new command: 'system coredump delete all'.
Jul 24 10:04:10.951773 osdx OSDxCLI[396728]: User 'admin' entered the configuration menu.
Jul 24 10:04:11.073272 osdx OSDxCLI[396728]: User 'admin' added a new cfg line: 'set interfaces ethernet eth0 address 10.215.168.64/24'.
Jul 24 10:04:11.141671 osdx OSDxCLI[396728]: User 'admin' added a new cfg line: 'set interfaces ethernet eth0 traffic nat source rule 1 address masquerade'.
Jul 24 10:04:11.237422 osdx OSDxCLI[396728]: User 'admin' added a new cfg line: 'set protocols static route 0.0.0.0/0 next-hop 10.215.168.1'.
Jul 24 10:04:11.301712 osdx OSDxCLI[396728]: User 'admin' added a new cfg line: 'set service dns static host-name WAN inet 10.215.168.1'.
Jul 24 10:04:11.414732 osdx OSDxCLI[396728]: User 'admin' added a new cfg line: 'set interfaces ethernet eth1 vif 101 address 40.0.0.1/8'.
Jul 24 10:04:11.472990 osdx OSDxCLI[396728]: User 'admin' added a new cfg line: 'set interfaces ethernet eth1 vif 201 address 20.0.0.1/8'.
Jul 24 10:04:11.583729 osdx OSDxCLI[396728]: User 'admin' added a new cfg line: 'show working'.
Jul 24 10:04:11.651225 osdx ubnt-cfgd[397274]: inactive
Jul 24 10:04:11.684511 osdx INFO[397285]: FRR daemons did not change
Jul 24 10:04:11.716094 osdx kernel: 8021q: adding VLAN 0 to HW filter on device eth1
Jul 24 10:04:11.739707 osdx WARNING[397327]: No supported link modes on interface eth1
Jul 24 10:04:11.741412 osdx modulelauncher[397327]: osdx.utils.xos cmd error: /sbin/ethtool -A eth1 autoneg on
Jul 24 10:04:11.741426 osdx modulelauncher[397327]: Command '/sbin/ethtool -A eth1 autoneg on' returned non-zero exit status 76.
Jul 24 10:04:11.742726 osdx modulelauncher[397327]: osdx.utils.xos cmd error: /sbin/ethtool -s eth1 autoneg on advertise Asym_Pause off Pause off --
Jul 24 10:04:11.742734 osdx modulelauncher[397327]: Command '/sbin/ethtool -s eth1 autoneg on advertise Asym_Pause off Pause off --' returned non-zero exit status 75.
Jul 24 10:04:11.776094 osdx kernel: 8021q: adding VLAN 0 to HW filter on device eth0
Jul 24 10:04:11.820924 osdx WARNING[397402]: No supported link modes on interface eth0
Jul 24 10:04:11.822603 osdx modulelauncher[397402]: osdx.utils.xos cmd error: /sbin/ethtool -A eth0 autoneg on
Jul 24 10:04:11.822621 osdx modulelauncher[397402]: Command '/sbin/ethtool -A eth0 autoneg on' returned non-zero exit status 76.
Jul 24 10:04:11.823925 osdx modulelauncher[397402]: osdx.utils.xos cmd error: /sbin/ethtool -s eth0 autoneg on advertise Asym_Pause off Pause off --
Jul 24 10:04:11.823935 osdx modulelauncher[397402]: Command '/sbin/ethtool -s eth0 autoneg on advertise Asym_Pause off Pause off --' returned non-zero exit status 75.
Jul 24 10:04:11.832643 osdx (udev-worker)[397415]: Network interface NamePolicy= disabled on kernel command line.
Jul 24 10:04:12.220011 osdx cfgd[1923]: [396728]Completed change to active configuration
Jul 24 10:04:12.251673 osdx OSDxCLI[396728]: User 'admin' committed the configuration.
Jul 24 10:04:12.277377 osdx OSDxCLI[396728]: User 'admin' left the configuration menu.
Jul 24 10:04:15.277475 osdx OSDxCLI[396728]: User 'admin' executed a new command: 'ping 10.215.168.1 count 1 size 56 timeout 1'.
Jul 24 10:04:15.362138 osdx OSDxCLI[396728]: User 'admin' executed a new command: 'ping 40.0.0.2 count 1 size 56 timeout 1'.
Jul 24 10:04:15.442767 osdx OSDxCLI[396728]: User 'admin' executed a new command: 'ping 20.0.0.2 count 1 size 56 timeout 1'.
Jul 24 10:04:15.932702 osdx file_operation[397613]: using src url: http://10.215.168.1/~robot/test-performance.rules dst url: running://
Jul 24 10:04:15.957823 osdx OSDxCLI[396728]: User 'admin' executed a new command: 'file copy http://10.215.168.1/~robot/test-performance.rules running:// force'.
Jul 24 10:04:16.155494 osdx OSDxCLI[396728]: User 'admin' executed a new command: 'file show running://test-performance.rules'.
Jul 24 10:04:16.335375 osdx OSDxCLI[396728]: User 'admin' entered the configuration menu.
Jul 24 10:04:16.422550 osdx OSDxCLI[396728]: User 'admin' added a new cfg line: 'set service firewall FW ruleset file running://test-performance.rules'.
Jul 24 10:04:16.515769 osdx OSDxCLI[396728]: User 'admin' added a new cfg line: 'set service firewall FW mode inline queue FW_Q'.
Jul 24 10:04:16.579565 osdx OSDxCLI[396728]: User 'admin' added a new cfg line: 'set service firewall FW logging outputs fast'.
Jul 24 10:04:16.706996 osdx OSDxCLI[396728]: User 'admin' added a new cfg line: 'set service firewall FW logging level config'.
Jul 24 10:04:16.818547 osdx OSDxCLI[396728]: User 'admin' added a new cfg line: 'set service firewall FW validator-timeout 20'.
Jul 24 10:04:16.921012 osdx OSDxCLI[396728]: User 'admin' added a new cfg line: 'set traffic queue FW_Q elements 1'.
Jul 24 10:04:17.038223 osdx OSDxCLI[396728]: User 'admin' added a new cfg line: 'set interfaces ethernet eth1 vif 101 traffic policy in FW_PLAN'.
Jul 24 10:04:17.117961 osdx OSDxCLI[396728]: User 'admin' added a new cfg line: 'set interfaces ethernet eth1 vif 201 traffic policy in FW_PLAN'.
Jul 24 10:04:17.182888 osdx OSDxCLI[396728]: User 'admin' added a new cfg line: 'set service firewall FW stream bypass mark 129834765'.
Jul 24 10:04:17.289208 osdx OSDxCLI[396728]: User 'admin' added a new cfg line: 'set service firewall FW stream bypass mask 129834765'.
Jul 24 10:04:17.341606 osdx OSDxCLI[396728]: User 'admin' added a new cfg line: 'set traffic label BYPASS'.
Jul 24 10:04:17.464584 osdx OSDxCLI[396728]: User 'admin' added a new cfg line: 'set traffic policy FW-SKIP rule 1 log prefix SKIP'.
Jul 24 10:04:17.532905 osdx OSDxCLI[396728]: User 'admin' added a new cfg line: 'set traffic policy FW-SKIP rule 1 selector MARKED-PACKETS'.
Jul 24 10:04:17.633145 osdx OSDxCLI[396728]: User 'admin' added a new cfg line: 'set traffic policy FW-SKIP rule 1 set label BYPASS'.
Jul 24 10:04:17.707147 osdx OSDxCLI[396728]: User 'admin' added a new cfg line: 'set traffic selector MARKED-PACKETS rule 1 mark 129834765'.
Jul 24 10:04:17.813244 osdx OSDxCLI[396728]: User 'admin' added a new cfg line: 'set traffic selector FW_SEL_ENQUEUE rule 1 not label BYPASS'.
Jul 24 10:04:17.923417 osdx OSDxCLI[396728]: User 'admin' added a new cfg line: 'set traffic policy FW_PLAN rule 1 selector FW_SEL_ENQUEUE'.
Jul 24 10:04:18.068342 osdx OSDxCLI[396728]: User 'admin' added a new cfg line: 'set interfaces ethernet eth1 vif 101 traffic policy out FW-SKIP'.
Jul 24 10:04:18.157600 osdx OSDxCLI[396728]: User 'admin' added a new cfg line: 'set interfaces ethernet eth1 vif 201 traffic policy out FW-SKIP'.
Jul 24 10:04:18.254873 osdx OSDxCLI[396728]: User 'admin' added a new cfg line: 'set traffic policy FW_PLAN rule 1 action enqueue FW_Q'.
Jul 24 10:04:18.381469 osdx OSDxCLI[396728]: User 'admin' added a new cfg line: 'show working'.
Jul 24 10:04:18.465557 osdx ubnt-cfgd[397666]: inactive
Jul 24 10:04:18.561786 osdx INFO[397714]: FRR daemons did not change
Jul 24 10:04:18.806942 osdx systemd[1]: Reloading.
Jul 24 10:04:18.896161 osdx systemd-sysv-generator[397766]: stat() failed on /etc/init.d/README, ignoring: No such file or directory
Jul 24 10:04:19.028507 osdx systemd[1]: Starting suricata@FW.service - Suricata client "FW" service...
Jul 24 10:04:19.047007 osdx systemd[1]: Started suricata@FW.service - Suricata client "FW" service.
Jul 24 10:04:19.275362 osdx INFO[397746]: Rules successfully loaded
Jul 24 10:04:19.282669 osdx cfgd[1923]: [396728]Completed change to active configuration
Jul 24 10:04:19.283177 osdx OSDxCLI[396728]: User 'admin' committed the configuration.
Jul 24 10:04:19.298508 osdx OSDxCLI[396728]: User 'admin' left the configuration menu.
Jul 24 10:04:19.481418 osdx OSDxCLI[396728]: User 'admin' executed a new command: 'ping 40.0.0.2 count 1 size 56 timeout 1'.
Jul 24 10:04:19.561207 osdx OSDxCLI[396728]: User 'admin' executed a new command: 'ping 20.0.0.2 count 1 size 56 timeout 1'.
Jul 24 10:04:19.964118 osdx kernel: [SKIP-1] ACCEPT IN=eth1.201 OUT=eth1.101 MAC=de:ad:be:ef:6c:01:de:ad:be:ef:6c:21:08:00:45:00:00:59 SRC=20.0.0.2 DST=40.0.0.2 LEN=89 TOS=0x00 PREC=0x00 TTL=63 ID=53275 DF PROTO=TCP SPT=40546 DPT=5001 WINDOW=502 RES=0x00 ACK PSH URGP=0 MARK=0x7bd1f0d
Jul 24 10:04:19.964196 osdx kernel: [SKIP-1] ACCEPT IN=eth1.201 OUT=eth1.101 MAC=de:ad:be:ef:6c:01:de:ad:be:ef:6c:21:08:00:45:00:00:59 SRC=20.0.0.2 DST=40.0.0.2 LEN=89 TOS=0x00 PREC=0x00 TTL=63 ID=19178 DF PROTO=TCP SPT=40562 DPT=5001 WINDOW=502 RES=0x00 ACK PSH URGP=0 MARK=0x7bd1f0d
Jul 24 10:04:30.131938 osdx OSDxCLI[396728]: User 'admin' executed a new command: 'service firewall FW show logging fast | tail'.
Note
The following steps are just a reiteration of the previous test, but with the difference that the packet mark is an extra mark.
Step 11: Modify the following configuration lines in DUT0 :
set service firewall FW stream bypass extra-mark 1 mask 3294967295
set service firewall FW stream bypass extra-mark 1 value 3294967295
set traffic policy FW-SKIP rule 1 selector FW_SEL_EXTRA_MARK
set traffic selector FW_SEL_EXTRA_MARK rule 1 extra-mark 1 value 3294967295
Step 12: Initiate a bandwidth test from DUT2 to DUT1
admin@DUT1$ monitor test performance server port 5001
admin@DUT2$ monitor test performance client 40.0.0.2 duration 10 port 5001 parallel 1
Expect the following output on
DUT2:Connecting to host 40.0.0.2, port 5001 [ 5] local 20.0.0.2 port 58126 connected to 40.0.0.2 port 5001 [ ID] Interval Transfer Bitrate Retr Cwnd [ 5] 0.00-1.00 sec 240 MBytes 2.02 Gbits/sec 0 1.61 MBytes [ 5] 1.00-2.00 sec 204 MBytes 1.71 Gbits/sec 0 1.61 MBytes [ 5] 2.00-3.00 sec 204 MBytes 1.71 Gbits/sec 0 1.61 MBytes [ 5] 3.00-4.00 sec 214 MBytes 1.79 Gbits/sec 85 1.25 MBytes [ 5] 4.00-5.00 sec 178 MBytes 1.49 Gbits/sec 0 1.36 MBytes [ 5] 5.00-6.00 sec 136 MBytes 1.14 Gbits/sec 0 1.44 MBytes [ 5] 6.00-7.00 sec 188 MBytes 1.57 Gbits/sec 0 1.51 MBytes [ 5] 7.00-8.00 sec 235 MBytes 1.98 Gbits/sec 80 1.15 MBytes [ 5] 8.00-9.00 sec 251 MBytes 2.11 Gbits/sec 0 1.30 MBytes [ 5] 9.00-10.00 sec 171 MBytes 1.44 Gbits/sec 0 1.38 MBytes - - - - - - - - - - - - - - - - - - - - - - - - - [ ID] Interval Transfer Bitrate Retr [ 5] 0.00-10.00 sec 1.97 GBytes 1.69 Gbits/sec 165 sender [ 5] 0.00-10.01 sec 1.97 GBytes 1.69 Gbits/sec receiver iperf Done.
Step 13: Run the command service firewall FW show logging fast | tail on DUT0 and check whether the output matches the following regular expressions:
(?m)^.+(Skipping test network performance TCP traffic).+$Show output
07/24/2026-10:04:19.961496  [**] [1:40:0] Skipping test network performance TCP traffic [**] [Classification: (null)] [Priority: 3] {TCP} 20.0.0.2:40546 -> 40.0.0.2:5001
07/24/2026-10:04:19.962527  [**] [1:40:0] Skipping test network performance TCP traffic [**] [Classification: (null)] [Priority: 3] {TCP} 20.0.0.2:40562 -> 40.0.0.2:5001
07/24/2026-10:04:35.541428  [**] [1:40:0] Skipping test network performance TCP traffic [**] [Classification: (null)] [Priority: 3] {TCP} 20.0.0.2:58114 -> 40.0.0.2:5001
07/24/2026-10:04:35.542634  [**] [1:40:0] Skipping test network performance TCP traffic [**] [Classification: (null)] [Priority: 3] {TCP} 20.0.0.2:58126 -> 40.0.0.2:5001
Step 14: Run the command system journal show | cat on DUT0 and check whether the output matches the following regular expressions:
(?m)^.*\[SKIP\-1\].*$Show output
Jul 24 10:04:10.000115 osdx systemd[1]: Started systemd-timedated.service - Time & Date Service.
Jul 24 10:04:10.000273 osdx systemd-timedated[397241]: Changed local time to Fri 2026-07-24 10:04:10 UTC
Jul 24 10:04:10.002694 osdx OSDxCLI[396728]: User 'admin' executed a new command: 'set date 2026-07-24 10:04:10'.
Jul 24 10:04:10.004088 osdx systemd-journald[2180]: Time jumped backwards, rotating.
Jul 24 10:04:10.374770 osdx systemd-journald[2180]: Runtime Journal (/run/log/journal/3a8dbab828fc40a183893e468c03e10b) is 1.9M, max 13.8M, 11.9M free.
Jul 24 10:04:10.376097 osdx systemd-journald[2180]: Received client request to rotate journal, rotating.
Jul 24 10:04:10.376160 osdx systemd-journald[2180]: Vacuuming done, freed 0B of archived journals from /run/log/journal/3a8dbab828fc40a183893e468c03e10b.
Jul 24 10:04:10.394042 osdx OSDxCLI[396728]: User 'admin' executed a new command: 'system journal clear'.
Jul 24 10:04:10.685016 osdx OSDxCLI[396728]: User 'admin' executed a new command: 'system coredump delete all'.
Jul 24 10:04:10.951773 osdx OSDxCLI[396728]: User 'admin' entered the configuration menu.
Jul 24 10:04:11.073272 osdx OSDxCLI[396728]: User 'admin' added a new cfg line: 'set interfaces ethernet eth0 address 10.215.168.64/24'.
Jul 24 10:04:11.141671 osdx OSDxCLI[396728]: User 'admin' added a new cfg line: 'set interfaces ethernet eth0 traffic nat source rule 1 address masquerade'.
Jul 24 10:04:11.237422 osdx OSDxCLI[396728]: User 'admin' added a new cfg line: 'set protocols static route 0.0.0.0/0 next-hop 10.215.168.1'.
Jul 24 10:04:11.301712 osdx OSDxCLI[396728]: User 'admin' added a new cfg line: 'set service dns static host-name WAN inet 10.215.168.1'.
Jul 24 10:04:11.414732 osdx OSDxCLI[396728]: User 'admin' added a new cfg line: 'set interfaces ethernet eth1 vif 101 address 40.0.0.1/8'.
Jul 24 10:04:11.472990 osdx OSDxCLI[396728]: User 'admin' added a new cfg line: 'set interfaces ethernet eth1 vif 201 address 20.0.0.1/8'.
Jul 24 10:04:11.583729 osdx OSDxCLI[396728]: User 'admin' added a new cfg line: 'show working'.
Jul 24 10:04:11.651225 osdx ubnt-cfgd[397274]: inactive
Jul 24 10:04:11.684511 osdx INFO[397285]: FRR daemons did not change
Jul 24 10:04:11.716094 osdx kernel: 8021q: adding VLAN 0 to HW filter on device eth1
Jul 24 10:04:11.739707 osdx WARNING[397327]: No supported link modes on interface eth1
Jul 24 10:04:11.741412 osdx modulelauncher[397327]: osdx.utils.xos cmd error: /sbin/ethtool -A eth1 autoneg on
Jul 24 10:04:11.741426 osdx modulelauncher[397327]: Command '/sbin/ethtool -A eth1 autoneg on' returned non-zero exit status 76.
Jul 24 10:04:11.742726 osdx modulelauncher[397327]: osdx.utils.xos cmd error: /sbin/ethtool -s eth1 autoneg on advertise Asym_Pause off Pause off --
Jul 24 10:04:11.742734 osdx modulelauncher[397327]: Command '/sbin/ethtool -s eth1 autoneg on advertise Asym_Pause off Pause off --' returned non-zero exit status 75.
Jul 24 10:04:11.776094 osdx kernel: 8021q: adding VLAN 0 to HW filter on device eth0
Jul 24 10:04:11.820924 osdx WARNING[397402]: No supported link modes on interface eth0
Jul 24 10:04:11.822603 osdx modulelauncher[397402]: osdx.utils.xos cmd error: /sbin/ethtool -A eth0 autoneg on
Jul 24 10:04:11.822621 osdx modulelauncher[397402]: Command '/sbin/ethtool -A eth0 autoneg on' returned non-zero exit status 76.
Jul 24 10:04:11.823925 osdx modulelauncher[397402]: osdx.utils.xos cmd error: /sbin/ethtool -s eth0 autoneg on advertise Asym_Pause off Pause off --
Jul 24 10:04:11.823935 osdx modulelauncher[397402]: Command '/sbin/ethtool -s eth0 autoneg on advertise Asym_Pause off Pause off --' returned non-zero exit status 75.
Jul 24 10:04:11.832643 osdx (udev-worker)[397415]: Network interface NamePolicy= disabled on kernel command line.
Jul 24 10:04:12.220011 osdx cfgd[1923]: [396728]Completed change to active configuration
Jul 24 10:04:12.251673 osdx OSDxCLI[396728]: User 'admin' committed the configuration.
Jul 24 10:04:12.277377 osdx OSDxCLI[396728]: User 'admin' left the configuration menu.
Jul 24 10:04:15.277475 osdx OSDxCLI[396728]: User 'admin' executed a new command: 'ping 10.215.168.1 count 1 size 56 timeout 1'.
Jul 24 10:04:15.362138 osdx OSDxCLI[396728]: User 'admin' executed a new command: 'ping 40.0.0.2 count 1 size 56 timeout 1'.
Jul 24 10:04:15.442767 osdx OSDxCLI[396728]: User 'admin' executed a new command: 'ping 20.0.0.2 count 1 size 56 timeout 1'.
Jul 24 10:04:15.932702 osdx file_operation[397613]: using src url: http://10.215.168.1/~robot/test-performance.rules dst url: running://
Jul 24 10:04:15.957823 osdx OSDxCLI[396728]: User 'admin' executed a new command: 'file copy http://10.215.168.1/~robot/test-performance.rules running:// force'.
Jul 24 10:04:16.155494 osdx OSDxCLI[396728]: User 'admin' executed a new command: 'file show running://test-performance.rules'.
Jul 24 10:04:16.335375 osdx OSDxCLI[396728]: User 'admin' entered the configuration menu.
Jul 24 10:04:16.422550 osdx OSDxCLI[396728]: User 'admin' added a new cfg line: 'set service firewall FW ruleset file running://test-performance.rules'.
Jul 24 10:04:16.515769 osdx OSDxCLI[396728]: User 'admin' added a new cfg line: 'set service firewall FW mode inline queue FW_Q'.
Jul 24 10:04:16.579565 osdx OSDxCLI[396728]: User 'admin' added a new cfg line: 'set service firewall FW logging outputs fast'.
Jul 24 10:04:16.706996 osdx OSDxCLI[396728]: User 'admin' added a new cfg line: 'set service firewall FW logging level config'.
Jul 24 10:04:16.818547 osdx OSDxCLI[396728]: User 'admin' added a new cfg line: 'set service firewall FW validator-timeout 20'.
Jul 24 10:04:16.921012 osdx OSDxCLI[396728]: User 'admin' added a new cfg line: 'set traffic queue FW_Q elements 1'.
Jul 24 10:04:17.038223 osdx OSDxCLI[396728]: User 'admin' added a new cfg line: 'set interfaces ethernet eth1 vif 101 traffic policy in FW_PLAN'.
Jul 24 10:04:17.117961 osdx OSDxCLI[396728]: User 'admin' added a new cfg line: 'set interfaces ethernet eth1 vif 201 traffic policy in FW_PLAN'.
Jul 24 10:04:17.182888 osdx OSDxCLI[396728]: User 'admin' added a new cfg line: 'set service firewall FW stream bypass mark 129834765'.
Jul 24 10:04:17.289208 osdx OSDxCLI[396728]: User 'admin' added a new cfg line: 'set service firewall FW stream bypass mask 129834765'.
Jul 24 10:04:17.341606 osdx OSDxCLI[396728]: User 'admin' added a new cfg line: 'set traffic label BYPASS'.
Jul 24 10:04:17.464584 osdx OSDxCLI[396728]: User 'admin' added a new cfg line: 'set traffic policy FW-SKIP rule 1 log prefix SKIP'.
Jul 24 10:04:17.532905 osdx OSDxCLI[396728]: User 'admin' added a new cfg line: 'set traffic policy FW-SKIP rule 1 selector MARKED-PACKETS'.
Jul 24 10:04:17.633145 osdx OSDxCLI[396728]: User 'admin' added a new cfg line: 'set traffic policy FW-SKIP rule 1 set label BYPASS'.
Jul 24 10:04:17.707147 osdx OSDxCLI[396728]: User 'admin' added a new cfg line: 'set traffic selector MARKED-PACKETS rule 1 mark 129834765'.
Jul 24 10:04:17.813244 osdx OSDxCLI[396728]: User 'admin' added a new cfg line: 'set traffic selector FW_SEL_ENQUEUE rule 1 not label BYPASS'.
Jul 24 10:04:17.923417 osdx OSDxCLI[396728]: User 'admin' added a new cfg line: 'set traffic policy FW_PLAN rule 1 selector FW_SEL_ENQUEUE'.
Jul 24 10:04:18.068342 osdx OSDxCLI[396728]: User 'admin' added a new cfg line: 'set interfaces ethernet eth1 vif 101 traffic policy out FW-SKIP'.
Jul 24 10:04:18.157600 osdx OSDxCLI[396728]: User 'admin' added a new cfg line: 'set interfaces ethernet eth1 vif 201 traffic policy out FW-SKIP'.
Jul 24 10:04:18.254873 osdx OSDxCLI[396728]: User 'admin' added a new cfg line: 'set traffic policy FW_PLAN rule 1 action enqueue FW_Q'.
Jul 24 10:04:18.381469 osdx OSDxCLI[396728]: User 'admin' added a new cfg line: 'show working'.
Jul 24 10:04:18.465557 osdx ubnt-cfgd[397666]: inactive
Jul 24 10:04:18.561786 osdx INFO[397714]: FRR daemons did not change
Jul 24 10:04:18.806942 osdx systemd[1]: Reloading.
Jul 24 10:04:18.896161 osdx systemd-sysv-generator[397766]: stat() failed on /etc/init.d/README, ignoring: No such file or directory
Jul 24 10:04:19.028507 osdx systemd[1]: Starting suricata@FW.service - Suricata client "FW" service...
Jul 24 10:04:19.047007 osdx systemd[1]: Started suricata@FW.service - Suricata client "FW" service.
Jul 24 10:04:19.275362 osdx INFO[397746]: Rules successfully loaded
Jul 24 10:04:19.282669 osdx cfgd[1923]: [396728]Completed change to active configuration
Jul 24 10:04:19.283177 osdx OSDxCLI[396728]: User 'admin' committed the configuration.
Jul 24 10:04:19.298508 osdx OSDxCLI[396728]: User 'admin' left the configuration menu.
Jul 24 10:04:19.481418 osdx OSDxCLI[396728]: User 'admin' executed a new command: 'ping 40.0.0.2 count 1 size 56 timeout 1'.
Jul 24 10:04:19.561207 osdx OSDxCLI[396728]: User 'admin' executed a new command: 'ping 20.0.0.2 count 1 size 56 timeout 1'.
Jul 24 10:04:19.964118 osdx kernel: [SKIP-1] ACCEPT IN=eth1.201 OUT=eth1.101 MAC=de:ad:be:ef:6c:01:de:ad:be:ef:6c:21:08:00:45:00:00:59 SRC=20.0.0.2 DST=40.0.0.2 LEN=89 TOS=0x00 PREC=0x00 TTL=63 ID=53275 DF PROTO=TCP SPT=40546 DPT=5001 WINDOW=502 RES=0x00 ACK PSH URGP=0 MARK=0x7bd1f0d
Jul 24 10:04:19.964196 osdx kernel: [SKIP-1] ACCEPT IN=eth1.201 OUT=eth1.101 MAC=de:ad:be:ef:6c:01:de:ad:be:ef:6c:21:08:00:45:00:00:59 SRC=20.0.0.2 DST=40.0.0.2 LEN=89 TOS=0x00 PREC=0x00 TTL=63 ID=19178 DF PROTO=TCP SPT=40562 DPT=5001 WINDOW=502 RES=0x00 ACK PSH URGP=0 MARK=0x7bd1f0d
Jul 24 10:04:30.131938 osdx OSDxCLI[396728]: User 'admin' executed a new command: 'service firewall FW show logging fast | tail'.
Jul 24 10:04:30.235678 osdx OSDxCLI[396728]: User 'admin' executed a new command: 'system journal show | cat'.
Jul 24 10:04:30.450677 osdx OSDxCLI[396728]: User 'admin' entered the configuration menu.
Jul 24 10:04:30.527681 osdx OSDxCLI[396728]: User 'admin' added a new cfg line: 'set service firewall FW ruleset file running://test-performance.rules'.
Jul 24 10:04:30.628629 osdx OSDxCLI[396728]: User 'admin' added a new cfg line: 'set service firewall FW mode inline queue FW_Q'.
Jul 24 10:04:30.692316 osdx OSDxCLI[396728]: User 'admin' added a new cfg line: 'set service firewall FW logging outputs fast'.
Jul 24 10:04:30.803299 osdx OSDxCLI[396728]: User 'admin' added a new cfg line: 'set service firewall FW logging level config'.
Jul 24 10:04:30.867586 osdx OSDxCLI[396728]: User 'admin' added a new cfg line: 'set service firewall FW validator-timeout 20'.
Jul 24 10:04:30.993291 osdx OSDxCLI[396728]: User 'admin' added a new cfg line: 'set traffic queue FW_Q elements 1'.
Jul 24 10:04:31.090175 osdx OSDxCLI[396728]: User 'admin' added a new cfg line: 'set interfaces ethernet eth1 vif 101 traffic policy in FW_PLAN'.
Jul 24 10:04:31.157310 osdx OSDxCLI[396728]: User 'admin' added a new cfg line: 'set interfaces ethernet eth1 vif 201 traffic policy in FW_PLAN'.
Jul 24 10:04:31.252136 osdx OSDxCLI[396728]: User 'admin' added a new cfg line: 'set service firewall FW stream bypass mark 129834765'.
Jul 24 10:04:31.318920 osdx OSDxCLI[396728]: User 'admin' added a new cfg line: 'set service firewall FW stream bypass mask 129834765'.
Jul 24 10:04:31.411046 osdx OSDxCLI[396728]: User 'admin' added a new cfg line: 'set traffic label BYPASS'.
Jul 24 10:04:31.468834 osdx OSDxCLI[396728]: User 'admin' added a new cfg line: 'set traffic policy FW-SKIP rule 1 log prefix SKIP'.
Jul 24 10:04:31.582783 osdx OSDxCLI[396728]: User 'admin' added a new cfg line: 'set traffic policy FW-SKIP rule 1 selector MARKED-PACKETS'.
Jul 24 10:04:31.641815 osdx OSDxCLI[396728]: User 'admin' added a new cfg line: 'set traffic policy FW-SKIP rule 1 set label BYPASS'.
Jul 24 10:04:31.746390 osdx OSDxCLI[396728]: User 'admin' added a new cfg line: 'set traffic selector MARKED-PACKETS rule 1 mark 129834765'.
Jul 24 10:04:31.822936 osdx OSDxCLI[396728]: User 'admin' added a new cfg line: 'set traffic selector FW_SEL_ENQUEUE rule 1 not label BYPASS'.
Jul 24 10:04:31.922335 osdx OSDxCLI[396728]: User 'admin' added a new cfg line: 'set traffic policy FW_PLAN rule 1 selector FW_SEL_ENQUEUE'.
Jul 24 10:04:31.987317 osdx OSDxCLI[396728]: User 'admin' added a new cfg line: 'set interfaces ethernet eth1 vif 101 traffic policy out FW-SKIP'.
Jul 24 10:04:32.122483 osdx OSDxCLI[396728]: User 'admin' added a new cfg line: 'set interfaces ethernet eth1 vif 201 traffic policy out FW-SKIP'.
Jul 24 10:04:32.186770 osdx OSDxCLI[396728]: User 'admin' added a new cfg line: 'set traffic policy FW_PLAN rule 1 action enqueue FW_Q'.
Jul 24 10:04:32.292557 osdx OSDxCLI[396728]: User 'admin' added a new cfg line: 'set service firewall FW stream bypass extra-mark 1 value 3294967295'.
Jul 24 10:04:32.353562 osdx OSDxCLI[396728]: User 'admin' added a new cfg line: 'set service firewall FW stream bypass extra-mark 1 mask 3294967295'.
Jul 24 10:04:32.493766 osdx OSDxCLI[396728]: User 'admin' added a new cfg line: 'set traffic policy FW-SKIP rule 1 selector FW_SEL_EXTRA_MARK'.
Jul 24 10:04:32.570488 osdx OSDxCLI[396728]: User 'admin' added a new cfg line: 'set traffic selector FW_SEL_EXTRA_MARK rule 1 extra-mark 1 value 3294967295'.
Jul 24 10:04:32.720866 osdx OSDxCLI[396728]: User 'admin' added a new cfg line: 'show changes'.
Jul 24 10:04:32.825564 osdx ubnt-cfgd[397888]: inactive
Jul 24 10:04:32.880518 osdx INFO[397911]: FRR daemons did not change
Jul 24 10:04:33.116755 osdx systemd[1]: Stopping suricata@FW.service - Suricata client "FW" service...
Jul 24 10:04:35.020130 osdx systemd[1]: suricata@FW.service: Deactivated successfully.
Jul 24 10:04:35.020289 osdx systemd[1]: Stopped suricata@FW.service - Suricata client "FW" service.
Jul 24 10:04:35.020333 osdx systemd[1]: suricata@FW.service: Consumed 1.946s CPU time.
Jul 24 10:04:35.048540 osdx systemd[1]: Starting suricata@FW.service - Suricata client "FW" service...
Jul 24 10:04:35.072118 osdx systemd[1]: Started suricata@FW.service - Suricata client "FW" service.
Jul 24 10:04:35.300472 osdx INFO[397938]: Rules successfully loaded
Jul 24 10:04:35.307905 osdx cfgd[1923]: [396728]Completed change to active configuration
Jul 24 10:04:35.308447 osdx OSDxCLI[396728]: User 'admin' committed the configuration.
Jul 24 10:04:35.324833 osdx OSDxCLI[396728]: User 'admin' left the configuration menu.
Jul 24 10:04:35.544126 osdx kernel: [SKIP-1] ACCEPT IN=eth1.201 OUT=eth1.101 MAC=de:ad:be:ef:6c:01:de:ad:be:ef:6c:21:08:00:45:00:00:59 SRC=20.0.0.2 DST=40.0.0.2 LEN=89 TOS=0x00 PREC=0x00 TTL=63 ID=175 DF PROTO=TCP SPT=58114 DPT=5001 WINDOW=502 RES=0x00 ACK PSH URGP=0 MARK=0x7bd1f0d EMARK1=0xc46535ff
Jul 24 10:04:35.544213 osdx kernel: [SKIP-1] ACCEPT IN=eth1.201 OUT=eth1.101 MAC=de:ad:be:ef:6c:01:de:ad:be:ef:6c:21:08:00:45:00:00:59 SRC=20.0.0.2 DST=40.0.0.2 LEN=89 TOS=0x00 PREC=0x00 TTL=63 ID=33640 DF PROTO=TCP SPT=58126 DPT=5001 WINDOW=502 RES=0x00 ACK PSH URGP=0 MARK=0x7bd1f0d EMARK1=0xc46535ff
Jul 24 10:04:40.038208 osdx systemd[1]: systemd-timedated.service: Deactivated successfully.
Jul 24 10:04:45.770176 osdx OSDxCLI[396728]: User 'admin' executed a new command: 'service firewall FW show logging fast | tail'.
Test Capture Bypass Using Conntrack Mark
Description
Builds a scenario with three DUTs in which a performance test is conducted between DUT1 and DUT2, and DUT0 is the router running the firewall. This test sets the conntrack mark directly, thus skipping all the steps required to set it later.
Performance must improve considerably compared to the Local Bypass test.
Then this test is broadened by using other conntrack marks that we have customized for the firewall.
Scenario
Step 1: Run the command file copy http://10.215.168.1/~robot/test-performance.rules running:// force on DUT0 and expect the following output:
Show output
  % Total    % Received % Xferd  Average Speed   Time    Time     Time  Current
                                 Dload  Upload   Total   Spent    Left  Speed
100   266  100   266    0     0  16642      0 --:--:-- --:--:-- --:--:-- 17733
Step 2: Run the command file show running://test-performance.rules on DUT0 and expect the following output:
Show output
alert tcp any any -> any 5001 (msg: "Skipping test network performance TCP traffic"; bypass; flow: established, to_server; sid: 40;)
alert udp any any -> any 5001 (msg: "Skipping test network performance UDP traffic"; bypass; flow: established, to_server; sid: 41;)
Step 3: Set the following configuration in DUT0 :
set interfaces ethernet eth0 address 10.215.168.64/24
set interfaces ethernet eth0 traffic nat source rule 1 address masquerade
set interfaces ethernet eth1 vif 101 address 40.0.0.1/8
set interfaces ethernet eth1 vif 101 traffic policy in FW_PLAN
set interfaces ethernet eth1 vif 201 address 20.0.0.1/8
set interfaces ethernet eth1 vif 201 traffic policy in FW_PLAN
set protocols static route 0.0.0.0/0 next-hop 10.215.168.1
set service dns static host-name WAN inet 10.215.168.1
set service firewall FW logging level config
set service firewall FW logging outputs fast
set service firewall FW mode inline queue FW_Q
set service firewall FW ruleset file 'running://test-performance.rules'
set service firewall FW stream bypass mark 129834765
set service firewall FW stream bypass mask 129834765
set service firewall FW stream bypass set-connmark
set service firewall FW validator-timeout 20
set system login user admin authentication encrypted-password '$6$GSjsCj8gHLv$/VcqU6FLi6CT2Oxn0MJQ2C2tqnRDrYKNF8HIYWJp68nvXvPdFccDsT04.WtigUONbKYrgKg8d6rEs8PjljMkH0'
set traffic policy FW_PLAN rule 2 action enqueue FW_Q
set traffic policy FW_PLAN rule 2 selector FW_SEL_ENQUEUE
set traffic queue FW_Q elements 1
set traffic selector FW_SEL_ENQUEUE rule 1 not connmark 129834765
Step 4: Ping the IP address 40.0.0.2 from DUT0:
admin@DUT0$ ping 40.0.0.2 count 1 size 56 timeout 1Show output
PING 40.0.0.2 (40.0.0.2) 56(84) bytes of data.
64 bytes from 40.0.0.2: icmp_seq=1 ttl=64 time=1.07 ms

--- 40.0.0.2 ping statistics ---
1 packets transmitted, 1 received, 0% packet loss, time 0ms
rtt min/avg/max/mdev = 1.072/1.072/1.072/0.000 ms
Step 5: Ping the IP address 20.0.0.2 from DUT0:
admin@DUT0$ ping 20.0.0.2 count 1 size 56 timeout 1Show output
PING 20.0.0.2 (20.0.0.2) 56(84) bytes of data.
64 bytes from 20.0.0.2: icmp_seq=1 ttl=64 time=0.533 ms

--- 20.0.0.2 ping statistics ---
1 packets transmitted, 1 received, 0% packet loss, time 0ms
rtt min/avg/max/mdev = 0.533/0.533/0.533/0.000 ms
Step 6: Ping the IP address 20.0.0.2 from DUT1:
admin@DUT1$ ping 20.0.0.2 count 1 size 56 timeout 1Show output
PING 20.0.0.2 (20.0.0.2) 56(84) bytes of data.
64 bytes from 20.0.0.2: icmp_seq=1 ttl=63 time=0.833 ms

--- 20.0.0.2 ping statistics ---
1 packets transmitted, 1 received, 0% packet loss, time 0ms
rtt min/avg/max/mdev = 0.833/0.833/0.833/0.000 ms
Step 7: Ping the IP address 40.0.0.2 from DUT2:
admin@DUT2$ ping 40.0.0.2 count 1 size 56 timeout 1Show output
PING 40.0.0.2 (40.0.0.2) 56(84) bytes of data.
64 bytes from 40.0.0.2: icmp_seq=1 ttl=63 time=0.562 ms

--- 40.0.0.2 ping statistics ---
1 packets transmitted, 1 received, 0% packet loss, time 0ms
rtt min/avg/max/mdev = 0.562/0.562/0.562/0.000 ms
Step 8: Initiate a bandwidth test from DUT2 to DUT1
admin@DUT1$ monitor test performance server port 5001
admin@DUT2$ monitor test performance client 40.0.0.2 duration 10 port 5001 parallel 1
Expect the following output on
DUT2:Connecting to host 40.0.0.2, port 5001 [ 5] local 20.0.0.2 port 47178 connected to 40.0.0.2 port 5001 [ ID] Interval Transfer Bitrate Retr Cwnd [ 5] 0.00-1.00 sec 257 MBytes 2.14 Gbits/sec 0 1.58 MBytes [ 5] 1.00-2.00 sec 318 MBytes 2.67 Gbits/sec 0 1.58 MBytes [ 5] 2.00-3.00 sec 259 MBytes 2.17 Gbits/sec 0 1.58 MBytes [ 5] 3.00-4.00 sec 238 MBytes 1.99 Gbits/sec 0 1.58 MBytes [ 5] 4.00-5.00 sec 265 MBytes 2.22 Gbits/sec 0 1.58 MBytes [ 5] 5.00-6.00 sec 238 MBytes 1.99 Gbits/sec 0 1.58 MBytes [ 5] 6.00-7.00 sec 205 MBytes 1.72 Gbits/sec 0 1.58 MBytes [ 5] 7.00-8.00 sec 241 MBytes 2.02 Gbits/sec 0 1.58 MBytes [ 5] 8.00-9.00 sec 249 MBytes 2.09 Gbits/sec 0 1.58 MBytes [ 5] 9.00-10.00 sec 241 MBytes 2.02 Gbits/sec 0 1.58 MBytes - - - - - - - - - - - - - - - - - - - - - - - - - [ ID] Interval Transfer Bitrate Retr [ 5] 0.00-10.00 sec 2.45 GBytes 2.10 Gbits/sec 0 sender [ 5] 0.00-10.00 sec 2.45 GBytes 2.10 Gbits/sec receiver iperf Done.
Step 9: Run the command service firewall FW show logging fast | tail on DUT0 and check whether the output matches the following regular expressions:
(?m)^.+(Skipping test network performance TCP traffic).+$Show output
07/24/2026-10:05:17.739838  [**] [1:40:0] Skipping test network performance TCP traffic [**] [Classification: (null)] [Priority: 3] {TCP} 20.0.0.2:47170 -> 40.0.0.2:5001
07/24/2026-10:05:17.741013  [**] [1:40:0] Skipping test network performance TCP traffic [**] [Classification: (null)] [Priority: 3] {TCP} 20.0.0.2:47178 -> 40.0.0.2:5001
Step 10: Run the command system conntrack show on DUT0 and check whether the output matches the following regular expressions:
(?m)^tcp\s+.*src=20.0.0.2 dst=40.0.0.2.+dport=5001.*mark=129834765.*$Show output
tcp      6 9 CLOSE src=20.0.0.2 dst=40.0.0.2 sport=47178 dport=5001 packets=1817152 bytes=2725035877 src=40.0.0.2 dst=20.0.0.2 sport=5001 dport=47178 packets=277543 bytes=14421720 [ASSURED] (Sc: not-bypass) mark=129834765 use=1
icmp     1 19 src=20.0.0.2 dst=40.0.0.2 type=8 code=0 id=49 packets=1 bytes=84 src=40.0.0.2 dst=20.0.0.2 type=0 code=0 id=49 packets=1 bytes=84 (Sc: not-bypass) mark=0 use=1
icmp     1 19 src=40.0.0.2 dst=20.0.0.2 type=8 code=0 id=121 packets=1 bytes=84 src=20.0.0.2 dst=40.0.0.2 type=0 code=0 id=121 packets=1 bytes=84 (Sc: not-bypass) mark=0 use=1
tcp      6 19 TIME_WAIT src=20.0.0.2 dst=40.0.0.2 sport=47170 dport=5001 packets=14 bytes=1193 src=40.0.0.2 dst=20.0.0.2 sport=5001 dport=47170 packets=13 bytes=1020 [ASSURED] (Sc: not-bypass) mark=129834765 use=1
icmp     1 19 src=40.0.0.1 dst=40.0.0.2 type=8 code=0 id=176 packets=1 bytes=84 src=40.0.0.2 dst=40.0.0.1 type=0 code=0 id=176 packets=1 bytes=84 (Sc: not-bypass) mark=0 use=1
icmp     1 19 src=20.0.0.1 dst=20.0.0.2 type=8 code=0 id=177 packets=1 bytes=84 src=20.0.0.2 dst=20.0.0.1 type=0 code=0 id=177 packets=1 bytes=84 (Sc: not-bypass) mark=0 use=1
conntrack v1.4.7 (conntrack-tools): 6 flow entries have been shown.
Note
The following steps are just a reiteration of the previous test, but with the difference that the conntrack mark used is an extra connmark.
Step 11: Modify the following configuration lines in DUT0 :
set service firewall FW stream bypass extra-mark 2 mask 3294967295
set service firewall FW stream bypass extra-mark 2 set-extra-connmark
set service firewall FW stream bypass extra-mark 2 value 3294967295
set traffic policy FW_PLAN rule 2 selector FW_SEL_EXTRA_MARK
set traffic selector FW_SEL_EXTRA_MARK rule 1 not extra-connmark 2 value 3294967295
Step 12: Initiate a bandwidth test from DUT2 to DUT1
admin@DUT1$ monitor test performance server port 5001
admin@DUT2$ monitor test performance client 40.0.0.2 duration 10 port 5001 parallel 1
Expect the following output on
DUT2:Connecting to host 40.0.0.2, port 5001 [ 5] local 20.0.0.2 port 36848 connected to 40.0.0.2 port 5001 [ ID] Interval Transfer Bitrate Retr Cwnd [ 5] 0.00-1.00 sec 234 MBytes 1.96 Gbits/sec 0 1.63 MBytes [ 5] 1.00-2.00 sec 210 MBytes 1.76 Gbits/sec 0 1.63 MBytes [ 5] 2.00-3.00 sec 239 MBytes 2.00 Gbits/sec 0 1.63 MBytes [ 5] 3.00-4.00 sec 200 MBytes 1.68 Gbits/sec 0 1.63 MBytes [ 5] 4.00-5.00 sec 245 MBytes 2.06 Gbits/sec 0 1.63 MBytes [ 5] 5.00-6.00 sec 181 MBytes 1.52 Gbits/sec 0 1.63 MBytes [ 5] 6.00-7.00 sec 132 MBytes 1.11 Gbits/sec 120 1.18 MBytes [ 5] 7.00-8.00 sec 214 MBytes 1.79 Gbits/sec 0 1.31 MBytes [ 5] 8.00-9.00 sec 295 MBytes 2.47 Gbits/sec 0 1.43 MBytes [ 5] 9.00-10.00 sec 300 MBytes 2.52 Gbits/sec 0 1.54 MBytes - - - - - - - - - - - - - - - - - - - - - - - - - [ ID] Interval Transfer Bitrate Retr [ 5] 0.00-10.00 sec 2.20 GBytes 1.89 Gbits/sec 120 sender [ 5] 0.00-10.00 sec 2.20 GBytes 1.89 Gbits/sec receiver iperf Done.
Step 13: Run the command service firewall FW show logging fast | tail on DUT0 and check whether the output matches the following regular expressions:
(?m)^.+(Skipping test network performance TCP traffic).+$Show output
07/24/2026-10:05:17.739838  [**] [1:40:0] Skipping test network performance TCP traffic [**] [Classification: (null)] [Priority: 3] {TCP} 20.0.0.2:47170 -> 40.0.0.2:5001
07/24/2026-10:05:17.741013  [**] [1:40:0] Skipping test network performance TCP traffic [**] [Classification: (null)] [Priority: 3] {TCP} 20.0.0.2:47178 -> 40.0.0.2:5001
07/24/2026-10:05:32.579748  [**] [1:40:0] Skipping test network performance TCP traffic [**] [Classification: (null)] [Priority: 3] {TCP} 20.0.0.2:36836 -> 40.0.0.2:5001
07/24/2026-10:05:32.580990  [**] [1:40:0] Skipping test network performance TCP traffic [**] [Classification: (null)] [Priority: 3] {TCP} 20.0.0.2:36848 -> 40.0.0.2:5001
Step 14: Run the command system conntrack show on DUT0 and check whether the output matches the following regular expressions:
(?m)^tcp\s+.*src=20.0.0.2 dst=40.0.0.2.+dport=5001.*emark2=3294967295.*$Show output
tcp      6 9 CLOSE src=20.0.0.2 dst=40.0.0.2 sport=36848 dport=5001 packets=1629386 bytes=2443590853 src=40.0.0.2 dst=20.0.0.2 sport=5001 dport=36848 packets=178678 bytes=9283884 [ASSURED] (Sc: not-bypass) mark=129834765 emark2=3294967295 use=1
tcp      6 19 TIME_WAIT src=20.0.0.2 dst=40.0.0.2 sport=36836 dport=5001 packets=14 bytes=1198 src=40.0.0.2 dst=20.0.0.2 sport=5001 dport=36836 packets=13 bytes=1018 [ASSURED] (Sc: not-bypass) mark=129834765 emark2=3294967295 use=1
conntrack v1.4.7 (conntrack-tools): 2 flow entries have been shown.
Test Bypass-Drop Using Conntrack Marks
Description
Builds a scenario with three DUTs in which a performance test is conducted between DUT1 and DUT2, and DUT0 is the router running the firewall. This test is aimed at configuring “Capture bypass drop” to avoid dropped packets from entering the firewall.
Scenario
Step 1: Run the command file copy http://10.215.168.1/~robot/drop-performance.rules running:// force on DUT0 and expect the following output:
Show output
  % Total    % Received % Xferd  Average Speed   Time    Time     Time  Current
                                 Dload  Upload   Total   Spent    Left  Speed
100   200  100   200    0     0   4917      0 --:--:-- --:--:-- --:--:--  5000
Step 2: Run the command file show running://drop-performance.rules on DUT0 and expect the following output:
Show output
drop tcp any any -> any 5000 (msg: "Dropping TCP performance test traffic"; sid: 1; flow: established, to_server;)
drop udp any any -> any 5001 (msg: "Dropping UDP performance test traffic"; sid: 2;)
Step 3: Set the following configuration in DUT0 :
set interfaces ethernet eth0 address 10.215.168.64/24
set interfaces ethernet eth0 traffic nat source rule 1 address masquerade
set interfaces ethernet eth1 vif 101 address 40.0.0.1/8
set interfaces ethernet eth1 vif 101 traffic policy in FW_PLAN
set interfaces ethernet eth1 vif 201 address 20.0.0.1/8
set interfaces ethernet eth1 vif 201 traffic policy in FW_PLAN
set protocols static route 0.0.0.0/0 next-hop 10.215.168.1
set service dns static host-name WAN inet 10.215.168.1
set service firewall FW bypass action drop set connmark mark 147652983
set service firewall FW logging level config
set service firewall FW logging outputs fast
set service firewall FW mode inline queue FW_Q
set service firewall FW ruleset file 'running://drop-performance.rules'
set service firewall FW validator-timeout 20
set system login user admin authentication encrypted-password '$6$GSjsCj8gHLv$/VcqU6FLi6CT2Oxn0MJQ2C2tqnRDrYKNF8HIYWJp68nvXvPdFccDsT04.WtigUONbKYrgKg8d6rEs8PjljMkH0'
set traffic policy FW_PLAN rule 1 action drop
set traffic policy FW_PLAN rule 1 selector FW_SEL_DROP
set traffic policy FW_PLAN rule 2 action enqueue FW_Q
set traffic queue FW_Q elements 1
set traffic selector FW_SEL_DROP rule 1 connmark 147652983
Step 4: Ping the IP address 40.0.0.2 from DUT0:
admin@DUT0$ ping 40.0.0.2 count 1 size 56 timeout 1Show output
PING 40.0.0.2 (40.0.0.2) 56(84) bytes of data.
64 bytes from 40.0.0.2: icmp_seq=1 ttl=64 time=0.801 ms

--- 40.0.0.2 ping statistics ---
1 packets transmitted, 1 received, 0% packet loss, time 0ms
rtt min/avg/max/mdev = 0.801/0.801/0.801/0.000 ms
Step 5: Ping the IP address 20.0.0.2 from DUT0:
admin@DUT0$ ping 20.0.0.2 count 1 size 56 timeout 1Show output
PING 20.0.0.2 (20.0.0.2) 56(84) bytes of data.
64 bytes from 20.0.0.2: icmp_seq=1 ttl=64 time=0.585 ms

--- 20.0.0.2 ping statistics ---
1 packets transmitted, 1 received, 0% packet loss, time 0ms
rtt min/avg/max/mdev = 0.585/0.585/0.585/0.000 ms
Step 6: Ping the IP address 20.0.0.2 from DUT1:
admin@DUT1$ ping 20.0.0.2 count 1 size 56 timeout 1Show output
PING 20.0.0.2 (20.0.0.2) 56(84) bytes of data.
64 bytes from 20.0.0.2: icmp_seq=1 ttl=63 time=0.555 ms

--- 20.0.0.2 ping statistics ---
1 packets transmitted, 1 received, 0% packet loss, time 0ms
rtt min/avg/max/mdev = 0.555/0.555/0.555/0.000 ms
Step 7: Ping the IP address 40.0.0.2 from DUT2:
admin@DUT2$ ping 40.0.0.2 count 1 size 56 timeout 1Show output
PING 40.0.0.2 (40.0.0.2) 56(84) bytes of data.
64 bytes from 40.0.0.2: icmp_seq=1 ttl=63 time=0.832 ms

--- 40.0.0.2 ping statistics ---
1 packets transmitted, 1 received, 0% packet loss, time 0ms
rtt min/avg/max/mdev = 0.832/0.832/0.832/0.000 ms
Step 8: Initiate a bandwidth test from DUT2 to DUT1
admin@DUT1$ monitor test performance server port 5000
admin@DUT2$ monitor test performance client 40.0.0.2 duration 10 port 5000 parallel 1
Expect the following output on
DUT2:^C- - - - - - - - - - - - - - - - - - - - - - - - - [ ID] Interval Transfer Bitrate Retr iperf3: interrupt - the client has terminated admin@osdx$
Step 9: Run the command service firewall FW show logging fast | tail on DUT0 and check whether the output matches the following regular expressions:
(?m)^.+(Dropping TCP performance test traffic).+$Show output
07/24/2026-10:06:09.314724 [Drop] [**] [1:1:0] Dropping TCP performance test traffic [**] [Classification: (null)] [Priority: 3] {TCP} 20.0.0.2:43514 -> 40.0.0.2:5000
Step 10: Run the command system conntrack show on DUT0 and check whether the output matches the following regular expressions:
(?m)^tcp\s+.*src=20.0.0.2 dst=40.0.0.2.+dport=5000.*mark=147652983.*$Show output
icmp     1 26 src=40.0.0.1 dst=40.0.0.2 type=8 code=0 id=181 packets=1 bytes=84 src=40.0.0.2 dst=40.0.0.1 type=0 code=0 id=181 packets=1 bytes=84 (Sc: not-bypass) mark=0 use=1
tcp      6 29 LAST_ACK src=20.0.0.2 dst=40.0.0.2 sport=43514 dport=5000 packets=7 bytes=557 src=40.0.0.2 dst=20.0.0.2 sport=5000 dport=43514 packets=4 bytes=217 [ASSURED] (Sc: not-bypass) mark=147652983 use=1
icmp     1 26 src=40.0.0.2 dst=20.0.0.2 type=8 code=0 id=124 packets=1 bytes=84 src=20.0.0.2 dst=40.0.0.2 type=0 code=0 id=124 packets=1 bytes=84 (Sc: not-bypass) mark=0 use=1
icmp     1 26 src=20.0.0.2 dst=40.0.0.2 type=8 code=0 id=52 packets=1 bytes=84 src=40.0.0.2 dst=20.0.0.2 type=0 code=0 id=52 packets=1 bytes=84 (Sc: not-bypass) mark=0 use=1
icmp     1 26 src=20.0.0.1 dst=20.0.0.2 type=8 code=0 id=182 packets=1 bytes=84 src=20.0.0.2 dst=20.0.0.1 type=0 code=0 id=182 packets=1 bytes=84 (Sc: not-bypass) mark=0 use=1
conntrack v1.4.7 (conntrack-tools): 5 flow entries have been shown.
Step 11: Run the command traffic policy FW_PLAN show on DUT0 and check whether the output matches the following regular expressions:
(?m)^1\s+FW_SEL_DROP\s+[1-9].*$Show output
Policy FW_PLAN -- ifc eth1.101 -- hook in prio very-high

------------------------------------------------------------------
rule    selector    pkts match  pkts eval  bytes match  bytes eval
------------------------------------------------------------------
1      FW_SEL_DROP           4          8          210         522
2      -                     4          4          312         312
------------------------------------------------------------------
Total                        8          8          522         522

Policy FW_PLAN -- ifc eth1.201 -- hook in prio very-high

------------------------------------------------------------------
rule    selector    pkts match  pkts eval  bytes match  bytes eval
------------------------------------------------------------------
1      FW_SEL_DROP           4         10          356         809
2      -                     6          6          453         453
------------------------------------------------------------------
Total                       10         10          809         809
Note
Testing with another conntrack mark.
Step 12: Modify the following configuration lines in DUT0 :
delete service firewall FW bypass action drop set connmark mark
set service firewall FW bypass action drop set connmark extra-mark 2 value 3967295294
set traffic policy FW_PLAN rule 1 selector FW_SEL_DROP_EM
set traffic selector FW_SEL_DROP_EM rule 1 extra-connmark 2 value 3967295294
Step 13: Initiate a bandwidth test from DUT2 to DUT1
admin@DUT1$ monitor test performance server port 5000
admin@DUT2$ monitor test performance client 40.0.0.2 duration 10 port 5000 parallel 1
Expect the following output on
DUT2:^C- - - - - - - - - - - - - - - - - - - - - - - - - [ ID] Interval Transfer Bitrate Retr iperf3: interrupt - the client has terminated admin@osdx$
Step 14: Run the command service firewall FW show logging fast | tail on DUT0 and check whether the output matches the following regular expressions:
(?m)^.+(Dropping TCP performance test traffic).+$Show output
07/24/2026-10:06:09.314724  [Drop] [**] [1:1:0] Dropping TCP performance test traffic [**] [Classification: (null)] [Priority: 3] {TCP} 20.0.0.2:43514 -> 40.0.0.2:5000
07/24/2026-10:06:15.450488  [Drop] [**] [1:1:0] Dropping TCP performance test traffic [**] [Classification: (null)] [Priority: 3] {TCP} 20.0.0.2:43514 -> 40.0.0.2:5000
07/24/2026-10:06:17.085772  [Drop] [**] [1:1:0] Dropping TCP performance test traffic [**] [Classification: (null)] [Priority: 3] {TCP} 20.0.0.2:44758 -> 40.0.0.2:5000
Step 15: Run the command system conntrack show on DUT0 and check whether the output matches the following regular expressions:
(?m)^tcp\s+.*src=20.0.0.2 dst=40.0.0.2.+dport=5000.*emark2=3967295294.*$Show output
tcp      6 19 TIME_WAIT src=20.0.0.2 dst=40.0.0.2 sport=44758 dport=5000 packets=8 bytes=646 src=40.0.0.2 dst=20.0.0.2 sport=5000 dport=44758 packets=5 bytes=270 [ASSURED] (Sc: not-bypass) mark=0 emark2=3967295294 use=1
conntrack v1.4.7 (conntrack-tools): 1 flow entries have been shown.
Step 16: Run the command traffic policy FW_PLAN show on DUT0 and check whether the output matches the following regular expressions:
(?m)^1\s+FW_SEL_DROP_EM\s+[1-9].*$Show output
Policy FW_PLAN -- ifc eth1.101 -- hook in prio very-high

---------------------------------------------------------------------
rule      selector     pkts match  pkts eval  bytes match  bytes eval
---------------------------------------------------------------------
1      FW_SEL_DROP_EM           4          7          210         376
2      -                        3          3          166         166
---------------------------------------------------------------------
Total                           7          7          376         376

Policy FW_PLAN -- ifc eth1.201 -- hook in prio very-high

---------------------------------------------------------------------
rule      selector     pkts match  pkts eval  bytes match  bytes eval
---------------------------------------------------------------------
1      FW_SEL_DROP_EM           5         10          445         775
2      -                        5          5          330         330
---------------------------------------------------------------------
Total                          10         10          775         775
Test Capture And Offload
Description
Builds a scenario with three DUTs in which a performance test is conducted between DUT1 and DUT2, and DUT0 is the router running the firewall. This test sets the conntrack mark directly, thus skipping all the steps required to set it later. In addition, OSDx is instructed to accelerate the flow using internal accelerators.
Performance must improve considerably compared to the previous test, to reach its top value.
Scenario
Step 1: Run the command file copy http://10.215.168.1/~robot/test-performance.rules running:// force on DUT0 and expect the following output:
Show output
  % Total    % Received % Xferd  Average Speed   Time    Time     Time  Current
                                 Dload  Upload   Total   Spent    Left  Speed
100   266  100   266    0     0  93497      0 --:--:-- --:--:-- --:--:--  129k
Step 2: Run the command file show running://test-performance.rules on DUT0 and expect the following output:
Show output
alert tcp any any -> any 5001 (msg: "Skipping test network performance TCP traffic"; bypass; flow: established, to_server; sid: 40;)
alert udp any any -> any 5001 (msg: "Skipping test network performance UDP traffic"; bypass; flow: established, to_server; sid: 41;)
Step 3: Set the following configuration in DUT0 :
set interfaces ethernet eth0 address 10.215.168.64/24
set interfaces ethernet eth0 traffic nat source rule 1 address masquerade
set interfaces ethernet eth1 vif 101 address 40.0.0.1/8
set interfaces ethernet eth1 vif 101 traffic policy in FW_PLAN
set interfaces ethernet eth1 vif 201 address 20.0.0.1/8
set interfaces ethernet eth1 vif 201 traffic policy in FW_PLAN
set protocols static route 0.0.0.0/0 next-hop 10.215.168.1
set service dns static host-name WAN inet 10.215.168.1
set service firewall FW logging level config
set service firewall FW logging outputs fast
set service firewall FW mode inline queue FW_Q
set service firewall FW ruleset file 'running://test-performance.rules'
set service firewall FW stream bypass action accept set conntrack offload-flag
set service firewall FW stream bypass mark 129834765
set service firewall FW stream bypass mask 129834765
set service firewall FW stream bypass set-connmark
set service firewall FW validator-timeout 20
set system login user admin authentication encrypted-password '$6$GSjsCj8gHLv$/VcqU6FLi6CT2Oxn0MJQ2C2tqnRDrYKNF8HIYWJp68nvXvPdFccDsT04.WtigUONbKYrgKg8d6rEs8PjljMkH0'
set traffic policy FW_PLAN rule 1 action enqueue FW_Q
set traffic policy FW_PLAN rule 2 action enqueue FW_Q
set traffic policy FW_PLAN rule 2 selector FW_SEL_ENQUEUE
set traffic queue FW_Q elements 1
set traffic selector FW_SEL_ENQUEUE rule 1 not connmark 129834765
Step 4: Ping the IP address 40.0.0.2 from DUT0:
admin@DUT0$ ping 40.0.0.2 count 1 size 56 timeout 1Show output
PING 40.0.0.2 (40.0.0.2) 56(84) bytes of data.
64 bytes from 40.0.0.2: icmp_seq=1 ttl=64 time=0.690 ms

--- 40.0.0.2 ping statistics ---
1 packets transmitted, 1 received, 0% packet loss, time 0ms
rtt min/avg/max/mdev = 0.690/0.690/0.690/0.000 ms
Step 5: Ping the IP address 20.0.0.2 from DUT0:
admin@DUT0$ ping 20.0.0.2 count 1 size 56 timeout 1Show output
PING 20.0.0.2 (20.0.0.2) 56(84) bytes of data.
64 bytes from 20.0.0.2: icmp_seq=1 ttl=64 time=1.90 ms

--- 20.0.0.2 ping statistics ---
1 packets transmitted, 1 received, 0% packet loss, time 0ms
rtt min/avg/max/mdev = 1.899/1.899/1.899/0.000 ms
Step 6: Ping the IP address 20.0.0.2 from DUT1:
admin@DUT1$ ping 20.0.0.2 count 1 size 56 timeout 1Show output
PING 20.0.0.2 (20.0.0.2) 56(84) bytes of data.
64 bytes from 20.0.0.2: icmp_seq=1 ttl=63 time=0.817 ms

--- 20.0.0.2 ping statistics ---
1 packets transmitted, 1 received, 0% packet loss, time 0ms
rtt min/avg/max/mdev = 0.817/0.817/0.817/0.000 ms
Step 7: Ping the IP address 40.0.0.2 from DUT2:
admin@DUT2$ ping 40.0.0.2 count 1 size 56 timeout 1Show output
PING 40.0.0.2 (40.0.0.2) 56(84) bytes of data.
64 bytes from 40.0.0.2: icmp_seq=1 ttl=63 time=0.717 ms

--- 40.0.0.2 ping statistics ---
1 packets transmitted, 1 received, 0% packet loss, time 0ms
rtt min/avg/max/mdev = 0.717/0.717/0.717/0.000 ms
Step 8: Initiate a background bandwidth test from DUT2 to DUT1. Control is returned, allowing other tasks to be performed while the test is running
admin@DUT1$ monitor test performance server port 5001
admin@DUT2$ monitor test performance client 40.0.0.2 duration 10 port 5001 parallel 1
Step 9: Run the command service firewall FW show logging fast | tail on DUT0 and check whether the output matches the following regular expressions:
(?m)^.+(Skipping test network performance TCP traffic).+$Show output
07/24/2026-10:06:43.883782  [**] [1:40:0] Skipping test network performance TCP traffic [**] [Classification: (null)] [Priority: 3] {TCP} 20.0.0.2:45974 -> 40.0.0.2:5001
07/24/2026-10:06:43.885441  [**] [1:40:0] Skipping test network performance TCP traffic [**] [Classification: (null)] [Priority: 3] {TCP} 20.0.0.2:45982 -> 40.0.0.2:5001
Step 10: Run the command system conntrack show on DUT0 and check whether the output matches the following regular expressions:
(?m)^tcp\s+.*src=20.0.0.2 dst=40.0.0.2.+dport=5001.+OFFLOAD.+mark=129834765.*$Show output
icmp     1 29 src=20.0.0.2 dst=40.0.0.2 type=8 code=0 id=55 packets=1 bytes=84 src=40.0.0.2 dst=20.0.0.2 type=0 code=0 id=55 packets=1 bytes=84 (Sc: not-bypass) mark=0 use=1
icmp     1 29 src=40.0.0.1 dst=40.0.0.2 type=8 code=0 id=186 packets=1 bytes=84 src=40.0.0.2 dst=40.0.0.1 type=0 code=0 id=186 packets=1 bytes=84 (Sc: not-bypass) mark=0 use=1
tcp      6 src=20.0.0.2 dst=40.0.0.2 sport=45974 dport=5001 packets=8 bytes=589 src=40.0.0.2 dst=20.0.0.2 sport=5001 dport=45974 packets=7 bytes=376 [ASSURED] [OFFLOAD, packets=2 bytes=104 packets=4 bytes=211] mark=129834765 use=3
icmp     1 29 src=40.0.0.2 dst=20.0.0.2 type=8 code=0 id=127 packets=1 bytes=84 src=20.0.0.2 dst=40.0.0.2 type=0 code=0 id=127 packets=1 bytes=84 (Sc: not-bypass) mark=0 use=1
tcp      6 src=20.0.0.2 dst=40.0.0.2 sport=45982 dport=5001 packets=38657 bytes=57964881 src=40.0.0.2 dst=20.0.0.2 sport=5001 dport=45982 packets=5480 bytes=285292 [ASSURED] [OFFLOAD, packets=38644 bytes=57949680 packets=5478 bytes=285180] mark=129834765 use=2
icmp     1 29 src=20.0.0.1 dst=20.0.0.2 type=8 code=0 id=187 packets=1 bytes=84 src=20.0.0.2 dst=20.0.0.1 type=0 code=0 id=187 packets=1 bytes=84 (Sc: not-bypass) mark=0 use=1
conntrack v1.4.7 (conntrack-tools): 6 flow entries have been shown.
Step 11: Stop the current bandwidth test between DUT2 and DUT1.
Step 12: Initiate a background bandwidth test from DUT2 to DUT1. Control is returned, allowing other tasks to be performed while the test is running
admin@DUT1$ monitor test performance server port 5001
admin@DUT2$ monitor test performance client 40.0.0.2 duration 10 udp port 5001 parallel 1
Step 13: Run the command service firewall FW show logging fast | tail on DUT0 and check whether the output matches the following regular expressions:
(?m)^.+(Skipping test network performance UDP traffic).+$Show output
07/24/2026-10:06:43.883782  [**] [1:40:0] Skipping test network performance TCP traffic [**] [Classification: (null)] [Priority: 3] {TCP} 20.0.0.2:45974 -> 40.0.0.2:5001
07/24/2026-10:06:43.885441  [**] [1:40:0] Skipping test network performance TCP traffic [**] [Classification: (null)] [Priority: 3] {TCP} 20.0.0.2:45982 -> 40.0.0.2:5001
07/24/2026-10:06:44.589389  [**] [1:40:0] Skipping test network performance TCP traffic [**] [Classification: (null)] [Priority: 3] {TCP} 20.0.0.2:45998 -> 40.0.0.2:5001
07/24/2026-10:06:44.590959  [**] [1:41:0] Skipping test network performance UDP traffic [**] [Classification: (null)] [Priority: 3] {UDP} 20.0.0.2:57619 -> 40.0.0.2:5001
07/24/2026-10:06:44.602119  [**] [1:41:0] Skipping test network performance UDP traffic [**] [Classification: (null)] [Priority: 3] {UDP} 20.0.0.2:57619 -> 40.0.0.2:5001
07/24/2026-10:06:44.614199  [**] [1:41:0] Skipping test network performance UDP traffic [**] [Classification: (null)] [Priority: 3] {UDP} 20.0.0.2:57619 -> 40.0.0.2:5001
Step 14: Run the command system conntrack show on DUT0 and check whether the output matches the following regular expressions:
(?m)^udp\s+.*src=20.0.0.2 dst=40.0.0.2.+dport=5001.+OFFLOAD.+mark=129834765.*$Show output
tcp      6 src=20.0.0.2 dst=40.0.0.2 sport=45998 dport=5001 packets=7 bytes=555 src=40.0.0.2 dst=20.0.0.2 sport=5001 dport=45998 packets=7 bytes=376 [ASSURED] [OFFLOAD, packets=1 bytes=52 packets=4 bytes=211] mark=129834765 use=3
icmp     1 29 src=20.0.0.2 dst=40.0.0.2 type=8 code=0 id=55 packets=1 bytes=84 src=40.0.0.2 dst=20.0.0.2 type=0 code=0 id=55 packets=1 bytes=84 (Sc: not-bypass) mark=0 use=1
icmp     1 28 src=40.0.0.1 dst=40.0.0.2 type=8 code=0 id=186 packets=1 bytes=84 src=40.0.0.2 dst=40.0.0.1 type=0 code=0 id=186 packets=1 bytes=84 (Sc: not-bypass) mark=0 use=1
tcp      6 src=20.0.0.2 dst=40.0.0.2 sport=45974 dport=5001 packets=11 bytes=746 src=40.0.0.2 dst=20.0.0.2 sport=5001 dport=45974 packets=9 bytes=480 [ASSURED] [OFFLOAD, packets=4 bytes=209 packets=4 bytes=211] mark=129834765 use=3
icmp     1 28 src=40.0.0.2 dst=20.0.0.2 type=8 code=0 id=127 packets=1 bytes=84 src=20.0.0.2 dst=40.0.0.2 type=0 code=0 id=127 packets=1 bytes=84 (Sc: not-bypass) mark=0 use=1
udp      17 src=20.0.0.2 dst=40.0.0.2 sport=57619 dport=5001 packets=12 bytes=16268 src=40.0.0.2 dst=20.0.0.2 sport=5001 dport=57619 packets=1 bytes=32 [OFFLOAD, packets=8 bytes=11808 packets=0 bytes=0] mark=129834765 use=2
icmp     1 28 src=20.0.0.1 dst=20.0.0.2 type=8 code=0 id=187 packets=1 bytes=84 src=20.0.0.2 dst=20.0.0.1 type=0 code=0 id=187 packets=1 bytes=84 (Sc: not-bypass) mark=0 use=1
conntrack v1.4.7 (conntrack-tools): 7 flow entries have been shown.
Step 15: Stop the current bandwidth test between DUT2 and DUT1.
Test Traffic Early Dropping
Description
Builds a scenario with three DUTs and a simple ruleset to drop TCP traffic between DUT1 and DUT2. Such traffic must pass through port 5000 for the rule to match. Later, XDP is queried to check if packets are being dropped at the specified interface.
The contents of the rule file are:
drop tcp any any -> any 5000 (msg: "Dropping TCP performance test traffic"; sid: 1; flow: established, to_server;)
This rule allows the connection to be established and traffic to be dropped later.
Scenario
Step 1: Run the command file copy http://10.215.168.1/~robot/drop-performance.rules running://drop-performance.rules force on DUT0 and expect the following output:
Show output
  % Total    % Received % Xferd  Average Speed   Time    Time     Time  Current
                                 Dload  Upload   Total   Spent    Left  Speed
100   200  100   200    0     0  28232      0 --:--:-- --:--:-- --:--:-- 28571
Step 2: Run the command file show running://drop-performance.rules on DUT0 and expect the following output:
Show output
drop tcp any any -> any 5000 (msg: "Dropping TCP performance test traffic"; sid: 1; flow: established, to_server;)
drop udp any any -> any 5001 (msg: "Dropping UDP performance test traffic"; sid: 2;)
Step 3: Set the following configuration in DUT0 :
set interfaces ethernet eth0 address 10.215.168.64/24
set interfaces ethernet eth0 traffic nat source rule 1 address masquerade
set interfaces ethernet eth1 vif 101 address 40.0.0.1/8
set interfaces ethernet eth1 vif 101 traffic policy in FW_PLAN
set interfaces ethernet eth1 vif 201 address 20.0.0.1/8
set interfaces ethernet eth1 vif 201 traffic policy in FW_PLAN
set protocols static route 0.0.0.0/0 next-hop 10.215.168.1
set service dns static host-name WAN inet 10.215.168.1
set service firewall FW logging level config
set service firewall FW logging outputs fast
set service firewall FW mode inline queue FW_Q
set service firewall FW ruleset file 'running://drop-performance.rules'
set service firewall FW stream bypass action drop set xdp-early-drop eth1
set service firewall FW validator-timeout 20
set system login user admin authentication encrypted-password '$6$GSjsCj8gHLv$/VcqU6FLi6CT2Oxn0MJQ2C2tqnRDrYKNF8HIYWJp68nvXvPdFccDsT04.WtigUONbKYrgKg8d6rEs8PjljMkH0'
set traffic policy FW_PLAN rule 1 action enqueue FW_Q
set traffic queue FW_Q elements 1
Step 4: Ping the IP address 40.0.0.2 from DUT0:
admin@DUT0$ ping 40.0.0.2 count 1 size 56 timeout 1Show output
PING 40.0.0.2 (40.0.0.2) 56(84) bytes of data.
64 bytes from 40.0.0.2: icmp_seq=1 ttl=64 time=0.632 ms

--- 40.0.0.2 ping statistics ---
1 packets transmitted, 1 received, 0% packet loss, time 0ms
rtt min/avg/max/mdev = 0.632/0.632/0.632/0.000 ms
Step 5: Ping the IP address 20.0.0.2 from DUT0:
admin@DUT0$ ping 20.0.0.2 count 1 size 56 timeout 1Show output
PING 20.0.0.2 (20.0.0.2) 56(84) bytes of data.
64 bytes from 20.0.0.2: icmp_seq=1 ttl=64 time=0.354 ms

--- 20.0.0.2 ping statistics ---
1 packets transmitted, 1 received, 0% packet loss, time 0ms
rtt min/avg/max/mdev = 0.354/0.354/0.354/0.000 ms
Step 6: Ping the IP address 20.0.0.2 from DUT1:
admin@DUT1$ ping 20.0.0.2 count 1 size 56 timeout 1Show output
PING 20.0.0.2 (20.0.0.2) 56(84) bytes of data.
64 bytes from 20.0.0.2: icmp_seq=1 ttl=63 time=0.686 ms

--- 20.0.0.2 ping statistics ---
1 packets transmitted, 1 received, 0% packet loss, time 0ms
rtt min/avg/max/mdev = 0.686/0.686/0.686/0.000 ms
Step 7: Ping the IP address 40.0.0.2 from DUT2:
admin@DUT2$ ping 40.0.0.2 count 1 size 56 timeout 1Show output
PING 40.0.0.2 (40.0.0.2) 56(84) bytes of data.
64 bytes from 40.0.0.2: icmp_seq=1 ttl=63 time=1.06 ms

--- 40.0.0.2 ping statistics ---
1 packets transmitted, 1 received, 0% packet loss, time 0ms
rtt min/avg/max/mdev = 1.060/1.060/1.060/0.000 ms
Step 8: Initiate a bandwidth test from DUT2 to DUT1
admin@DUT1$ monitor test performance server port 5000
admin@DUT2$ monitor test performance client 40.0.0.2 duration 10 port 5000 parallel 1
Expect the following output on
DUT2:^C- - - - - - - - - - - - - - - - - - - - - - - - - [ ID] Interval Transfer Bitrate Retr iperf3: interrupt - the client has terminated admin@osdx$
Step 9: Run the command service firewall FW show logging fast | tail on DUT0 and check whether the output matches the following regular expressions:
(?m)^.+(Dropping TCP performance test traffic).+$Show output
07/24/2026-10:07:08.895196 [Drop] [**] [1:1:0] Dropping TCP performance test traffic [**] [Classification: (null)] [Priority: 3] {TCP} 20.0.0.2:38262 -> 40.0.0.2:5000
Step 10: Run the command service firewall FW show early-drop-stats eth1 on DUT0 and check whether the output matches the following regular expressions:
yes\s+201\s+\d+\s+[1-9]\d*\s+[1-9]\d*Show output
------------------------------------------------------------------------
src       dst     src port  dst port  tcp  vlan_0  vlan_1  pkts  bytes
------------------------------------------------------------------------
20.0.0.2  40.0.0.2     38262      5000  yes     201       0     7    602
40.0.0.2  20.0.0.2      5000     38262  yes     201       0     0      0
Step 11: Run the command interfaces ethernet eth1 monitor xdp-stats times 1 on DUT0 and expect the following output:
Show output
Period of 0.250147s ending at 1784887632.780020
XDP_DROP               8 pkts (         4 pps)           0 KiB (     0 Mbits/s)
XDP_PASS              16 pkts (         4 pps)           1 KiB (     0 Mbits/s)
XDP_TX                 0 pkts (         0 pps)           0 KiB (     0 Mbits/s)
XDP_REDIRECT           0 pkts (         0 pps)           0 KiB (     0 Mbits/s)
Step 12: Initiate a bandwidth test from DUT2 to DUT1
admin@DUT1$ monitor test performance server port 5001
admin@DUT2$ monitor test performance client 40.0.0.2 duration 30 udp port 5001 parallel 1
Expect the following output on
DUT2:^C- - - - - - - - - - - - - - - - - - - - - - - - - [ ID] Interval Transfer Bitrate Jitter Lost/Total Datagrams iperf3: interrupt - the client has terminated admin@osdx$
Step 13: Run the command service firewall FW show logging fast | tail on DUT0 and check whether the output matches the following regular expressions:
(?m)^.+(Dropping UDP performance test traffic).+$Show output
07/24/2026-10:07:08.895196  [Drop] [**] [1:1:0] Dropping TCP performance test traffic [**] [Classification: (null)] [Priority: 3] {TCP} 20.0.0.2:38262 -> 40.0.0.2:5000
07/24/2026-10:07:12.993567  [Drop] [**] [1:2:0] Dropping UDP performance test traffic [**] [Classification: (null)] [Priority: 3] {UDP} 20.0.0.2:41866 -> 40.0.0.2:5001
Step 14: Run the command service firewall FW show early-drop-stats eth1 on DUT0 and check whether the output matches the following regular expressions:
yes\s+201\s+\d+\s+[1-9]\d*\s+[1-9]\d*Show output
------------------------------------------------------------------------
src       dst     src port  dst port  tcp  vlan_0  vlan_1  pkts  bytes
------------------------------------------------------------------------
20.0.0.2  40.0.0.2     38262      5000  yes     201       0    10    776
20.0.0.2  40.0.0.2     41866      5001  no      201       0     0      0
40.0.0.2  20.0.0.2      5001     41866  no      201       0     0      0
40.0.0.2  20.0.0.2      5000     38262  yes     201       0     0      0
Step 15: Run the command interfaces ethernet eth1 monitor xdp-stats times 1 on DUT0 and expect the following output:
Show output
Period of 0.250136s ending at 1784887636.719889
XDP_DROP              10 pkts (         0 pps)           0 KiB (     0 Mbits/s)
XDP_PASS              35 pkts (         0 pps)           2 KiB (     0 Mbits/s)
XDP_TX                 0 pkts (         0 pps)           0 KiB (     0 Mbits/s)
XDP_REDIRECT           0 pkts (         0 pps)           0 KiB (     0 Mbits/s)