Export Probe Stats
This scenario shows how to configure Network Service Monitor (NSM) operations to share probe statistics through syslog messages.
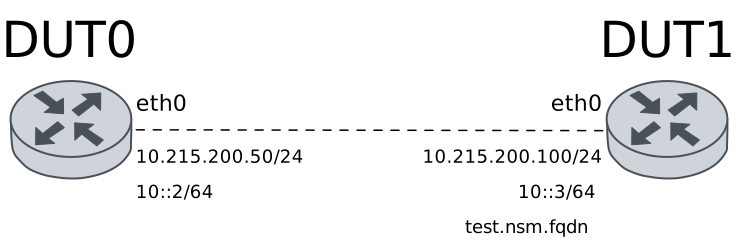
Test Export Probe Statistics
Description
NSM operations are configured to export probe statistics through syslog messages and sent to a local file. The UDP NSM responder service is configured in DUT1.
Scenario
Step 1: Set the following configuration in DUT1 :
set interfaces ethernet eth1 address 192.168.1.100/24
set service nsm responder type udp port 60000
set system login user admin authentication encrypted-password '$6$GSjsCj8gHLv$/VcqU6FLi6CT2Oxn0MJQ2C2tqnRDrYKNF8HIYWJp68nvXvPdFccDsT04.WtigUONbKYrgKg8d6rEs8PjljMkH0'
Step 2: Set the following configuration in DUT0 :
set interfaces ethernet eth1 address 192.168.1.50/24
set service nsm operation A destination-address 192.168.1.100
set service nsm operation A destination-port 60000
set service nsm operation A interval 0.05
set service nsm operation A local-address 192.168.1.50
set service nsm operation A local-interface eth1
set service nsm operation A logging log-interval 0.5
set service nsm operation A logging log-level info
set service nsm operation A type udp
set service nsm operation A window 100
set system login user admin authentication encrypted-password '$6$GSjsCj8gHLv$/VcqU6FLi6CT2Oxn0MJQ2C2tqnRDrYKNF8HIYWJp68nvXvPdFccDsT04.WtigUONbKYrgKg8d6rEs8PjljMkH0'
set system syslog file TEST filter FILTER app nsmd
set system syslog file TEST filter FILTER level all
Step 3: Run the command file show running://log/user/TEST/TEST on DUT0 and check whether the output matches the following regular expressions:
(?m)^.+nsmd.+Jitter.+PacketLoss.+RTT.+$Show output
2026-07-24 13:22:40.849513 user-notice , nsmd:  Notice: Starting NSM daemon
2026-07-24 13:22:40.851413 user-warning , nsmd:  Warning: "A": Buffer size (0) is less than minimum buffer size (16)
2026-07-24 13:22:40.851697 user-info , nsmd:  {"DstIP":"192.168.1.100","Jitter":0.0,"PacketLoss":0.0,"RTT":0.0,"SrcIP":"192.168.1.50","SrcIface":"eth1","Timestamp":1784899360}
2026-07-24 13:22:41.351855 user-info , nsmd:  {"DstIP":"192.168.1.100","Jitter":0.0086353600000000016,"PacketLoss":0.0,"RTT":0.04250172,"SrcIP":"192.168.1.50","SrcIface":"eth1","Timestamp":1784899361}
2026-07-24 13:22:41.852077 user-info , nsmd:  {"DstIP":"192.168.1.100","Jitter":0.018268019999999999,"PacketLoss":0.0,"RTT":0.086147860000000007,"SrcIP":"192.168.1.50","SrcIface":"eth1","Timestamp":1784899361}
2026-07-24 13:22:42.351978 user-info , nsmd:  {"DstIP":"192.168.1.100","Jitter":0.022584180000000002,"PacketLoss":0.0,"RTT":0.12511782000000002,"SrcIP":"192.168.1.50","SrcIface":"eth1","Timestamp":1784899362}
Note
The previous command output should show that probe statistics are being exported through syslog messages.
Test Export Probe Statistics FQDN
Description
As same as the previous scenario, but the FQDN of DUT1 is used instead of its IP address.
Scenario
Step 1: Set the following configuration in DUT1 :
set interfaces ethernet eth1 address 192.168.1.100/24
set service nsm responder type udp port 60000
set system login user admin authentication encrypted-password '$6$GSjsCj8gHLv$/VcqU6FLi6CT2Oxn0MJQ2C2tqnRDrYKNF8HIYWJp68nvXvPdFccDsT04.WtigUONbKYrgKg8d6rEs8PjljMkH0'
Step 2: Set the following configuration in DUT0 :
set interfaces ethernet eth1 address 192.168.1.50/24
set service dns static host-name testnsm alias test.nsm.fqdn
set service dns static host-name testnsm inet 192.168.1.100
set service nsm operation A destination-address test.nsm.fqdn
set service nsm operation A destination-port 60000
set service nsm operation A interval 0.05
set service nsm operation A local-address 192.168.1.50
set service nsm operation A local-interface eth1
set service nsm operation A logging log-interval 0.5
set service nsm operation A logging log-level info
set service nsm operation A type udp
set service nsm operation A window 100
set system login user admin authentication encrypted-password '$6$GSjsCj8gHLv$/VcqU6FLi6CT2Oxn0MJQ2C2tqnRDrYKNF8HIYWJp68nvXvPdFccDsT04.WtigUONbKYrgKg8d6rEs8PjljMkH0'
set system syslog file TEST filter FILTER app nsmd
set system syslog file TEST filter FILTER level all
Step 3: Run the command file show running://log/user/TEST/TEST on DUT0 and check whether the output matches the following regular expressions:
(?m)^.+nsmd.+test.nsm.fqdn.+Jitter.+PacketLoss.+RTT.+$Show output
2026-07-24 13:22:51.860783 user-notice , nsmd:  Notice: Starting NSM daemon
2026-07-24 13:22:51.862422 user-warning , nsmd:  Warning: "A": Buffer size (0) is less than minimum buffer size (16)
2026-07-24 13:22:51.862902 user-info , nsmd:  {"DstHostName":"test.nsm.fqdn","Jitter":0.0,"PacketLoss":0.0,"RTT":0.0,"SrcIP":"192.168.1.50","SrcIface":"eth1","Timestamp":1784899371}
2026-07-24 13:22:52.362991 user-info , nsmd:  {"DstHostName":"test.nsm.fqdn","Jitter":0.0072225799999999993,"PacketLoss":0.0,"RTT":0.041415569999999992,"SrcIP":"192.168.1.50","SrcIface":"eth1","Timestamp":1784899372}
2026-07-24 13:22:52.863188 user-info , nsmd:  {"DstHostName":"test.nsm.fqdn","Jitter":0.010683449999999999,"PacketLoss":0.0,"RTT":0.073675779999999996,"SrcIP":"192.168.1.50","SrcIface":"eth1","Timestamp":1784899372}
2026-07-24 13:22:53.363121 user-info , nsmd:  {"DstHostName":"test.nsm.fqdn","Jitter":0.016302590000000002,"PacketLoss":0.0,"RTT":0.10953019999999995,"SrcIP":"192.168.1.50","SrcIface":"eth1","Timestamp":1784899373}
Note
The previous command output should show that probe statistics are being exported through syslog messages.
Test Export Probe Statistics Towards Syslog Server
Description
NSM operations are configured to export probe statistics through syslog messages and sent to a remote syslog server.
Scenario
Step 1: Set the following configuration in DUT1 :
set interfaces ethernet eth0 address 10.215.168.65/24
set service nsm responder type udp port 60000
set system login user admin authentication encrypted-password '$6$GSjsCj8gHLv$/VcqU6FLi6CT2Oxn0MJQ2C2tqnRDrYKNF8HIYWJp68nvXvPdFccDsT04.WtigUONbKYrgKg8d6rEs8PjljMkH0'
Step 2: Set the following configuration in DUT0 :
set interfaces ethernet eth0 address 10.215.168.64/24
set service nsm operation A destination-address 10.215.168.65
set service nsm operation A destination-port 60000
set service nsm operation A interval 0.05
set service nsm operation A local-address 10.215.168.64
set service nsm operation A local-interface eth0
set service nsm operation A logging log-interval 0.5
set service nsm operation A logging log-level info
set service nsm operation A type udp
set service nsm operation A window 100
set system login user admin authentication encrypted-password '$6$GSjsCj8gHLv$/VcqU6FLi6CT2Oxn0MJQ2C2tqnRDrYKNF8HIYWJp68nvXvPdFccDsT04.WtigUONbKYrgKg8d6rEs8PjljMkH0'
set system syslog host 10.215.168.1 filter def app nsmd
set system syslog host 10.215.168.1 filter def level all
set system syslog host 10.215.168.1 port 10514
set system syslog host 10.215.168.1 protocol tcp
set system syslog host 10.215.168.1 x509 ca-certificate 'running://ca.crt'
set system syslog host 10.215.168.1 x509 permitted-peer rsyslog.server.com
Note
Check the server /var/log/10.215.168.64/.log file and search for the
(?m)^.+nsmd.+Jitter.+PacketLoss.+RTT.+$ log message: