System Monitoring
System monitoring refers to inspecting runtime system metrics such as CPU usage, temperature, or uptime, in real-time.
The last section of the show version command displays a snapshot of most useful
metrics:
admin@osdx$ show version

Bootloader name:           U-Boot
Bootloader version:        2018.03-g2fc31fe-1.19-0++teldat~master~26~2fc31fe
Bootloader build date:     Jun 28 2023 - 12:00:00

OS vendor:                 Windbit
OS name:                   OSDx
OS version:                v3.8.1.1
OS Linux kernel:           5.10.127
OS built by:               jenkins@daphne
OS build date:             Thu Jun 29 10:34:33 UTC 2023
OS installation:           physical
OS boot mode:              user
OS min bootloader:         0
License:                   RS420_BASE DPI RD-ETSI RD-FCC RD-NOM RD-ROW WLAN

Hardware vendor:           Windbit
Hardware model:            RS420
Hardware version:          1
Hardware S/N:              DAAXZ-000153
Hardware UUID:             299ad66a-b315-514d-91f5-7851c57401e6
Hardware architecture:     arm64
Hardware fwid:             marvell_a
Hardware base MAC:         00:a0:26:0e:00:9f
Hardware cpu:              1 x Cortex-A53 (2 cores)
Hardware mfg date:         2023W20

Last reboot reason:        Performed by user

Date:                      Thu 14 Feb 2019 12:18:46 PM UTC
Uptime:                    0:01:56
CPU load (1m, 5m, 15m):    1.17 0.73 0.29
CPU usage % (1m):          56.86
Storage usage (kB):        284877/3710628
Memory usage (kB):         246236/1002232
Temperature (ºC):          0
Users logged in:           1
Mode (current/next boot):  user/user

Hostname:                  osdx
Additionally, OSDx supports displaying some of these metrics in a text-based dynamic
graph through the monitor system graph command family.
Examples:
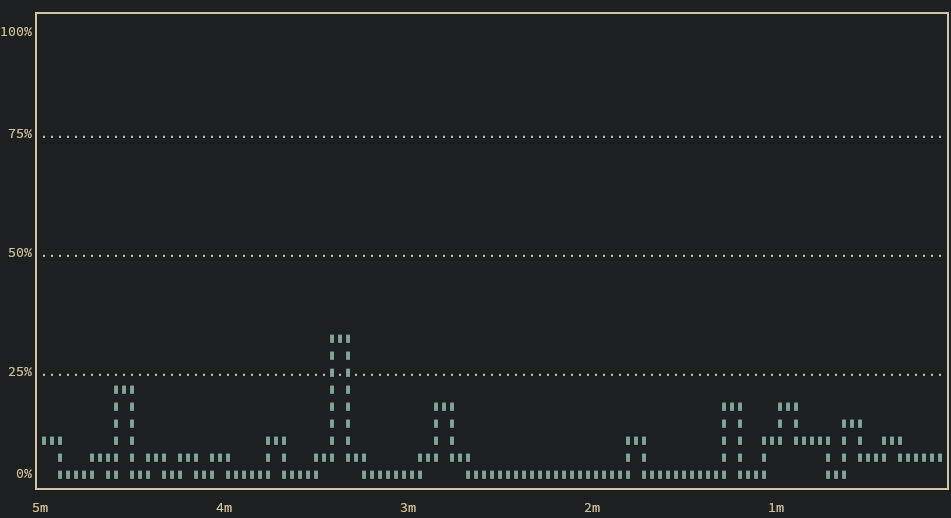
CPU graph
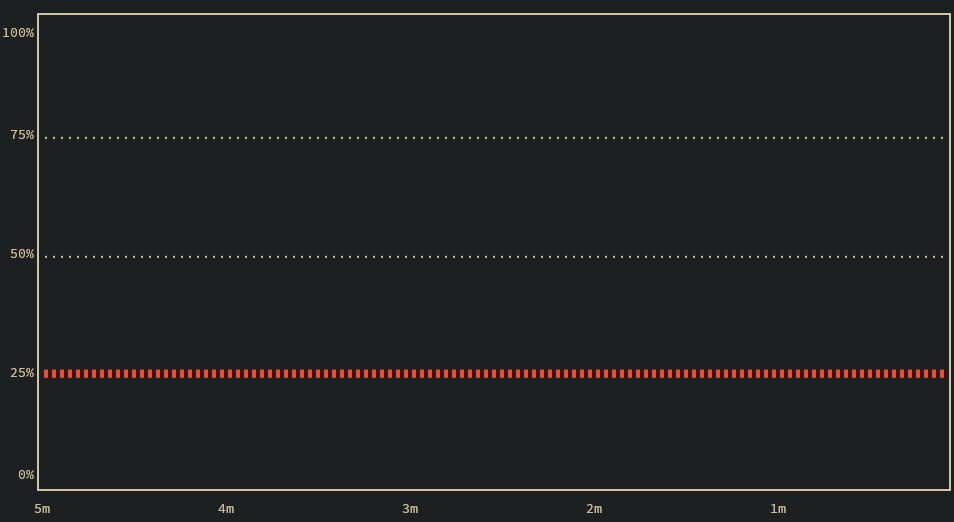
Memory graph
The graph may be exited by pressing Ctrl+C.