Netflow
These scenarios demonstrate how to configure and use NetFlow to collect and export local TCP flows, covering different modes and configuration options.
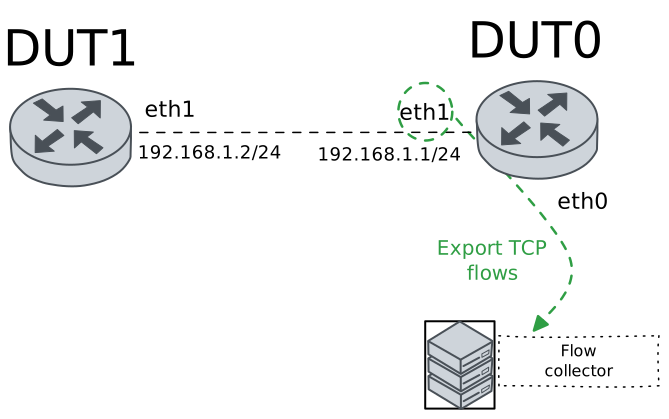
Test NetFlow Scenario
Description
These examples demonstrate how to configure and use NetFlow to collect and export locally generated TCP flows across different configuration modes.
Scenario
Example 1
Step 1: Set the following configuration in DUT0 :
set interfaces ethernet eth0 address 10.215.168.64/24
set interfaces ethernet eth1 address 192.168.1.1/24
set interfaces ethernet eth1 flow egress selector TCP_SEL
set interfaces ethernet eth1 flow ingress selector TCP_SEL
set system login user admin authentication encrypted-password '$6$GSjsCj8gHLv$/VcqU6FLi6CT2Oxn0MJQ2C2tqnRDrYKNF8HIYWJp68nvXvPdFccDsT04.WtigUONbKYrgKg8d6rEs8PjljMkH0'
set system netflow destination 10.215.168.1
set system netflow engine-id 1111
set traffic selector TCP_SEL rule 1 protocol tcp
Step 2: Set the following configuration in DUT1 :
set interfaces ethernet eth1 address 192.168.1.2/24
set system login user admin authentication encrypted-password '$6$GSjsCj8gHLv$/VcqU6FLi6CT2Oxn0MJQ2C2tqnRDrYKNF8HIYWJp68nvXvPdFccDsT04.WtigUONbKYrgKg8d6rEs8PjljMkH0'
Step 3: Run the command system netflow show status on DUT0 and check whether the output matches the following regular expressions:
Protocol\sversion\s10\s\(ipfix\)
Export:.*Errors 0 pkts
sock0:\s127.0.0.1:2055,.*err: sndbuf reached 0, connect 0, cberr \d+, other 0
Show output
ipt_NETFLOW 2.6, srcversion 14D0325538497163439882E; dir
Protocol version 10 (ipfix), refresh-rate 20, timeout-rate 30, (templates 0, active 1).
Timeouts: active 1800s, inactive 15s. Maxflows 2000000
Flows: active 0 (peak 4 reached 0d3h33m ago), mem 491K, worker delay 25/250 [1..25] (40 ms, 0 us, 0:0 [cpu2]).
Hash: size 62967 (mem 491K), metric 1.00 [1.00, 1.00, 1.00]. InHash: 0 pkt, 0 K, InPDU 0, 0.
Rate: 0 bits/sec, 0 packets/sec; Avg 1 min: 0 bps, 0 pps; 5 min: 0 bps, 0 pps
cpu#     pps; <search found new [metric], trunc frag alloc maxflows>, traffic: <pkt, bytes>, drop: <pkt, bytes>
Total      0;      0      4      4 [1.00],    0    0    0    0, traffic: 8, 0 MB, drop: 0, 0 K
cpu0       0;      0      0      0 [1.00],    0    0    0    0, traffic: 0, 0 MB, drop: 0, 0 K
cpu1       0;      0      1      2 [1.00],    0    0    0    0, traffic: 3, 0 MB, drop: 0, 0 K
cpu2       0;      0      3      2 [1.00],    0    0    0    0, traffic: 5, 0 MB, drop: 0, 0 K
cpu3       0;      0      0      0 [1.00],    0    0    0    0, traffic: 0, 0 MB, drop: 0, 0 K
Export: Rate 88 bytes/s; Total 5 pkts, 0 MB, 0 flows; Errors 0 pkts; Traffic lost 8 pkts, 0 Kbytes, 4 flows.
sock0: 127.0.0.1:2055, sndbuf 212992, filled 1, peak 1; err: sndbuf reached 0, connect 0, cberr 0, other 0
Step 4: Ping the IP address 192.168.1.2 from DUT0:
admin@DUT0$ ping 192.168.1.2 count 1 size 56 timeout 1Show output
PING 192.168.1.2 (192.168.1.2) 56(84) bytes of data.
64 bytes from 192.168.1.2: icmp_seq=1 ttl=64 time=0.542 ms

--- 192.168.1.2 ping statistics ---
1 packets transmitted, 1 received, 0% packet loss, time 0ms
rtt min/avg/max/mdev = 0.542/0.542/0.542/0.000 ms
Step 5: Ping the IP address 10.215.168.1 from DUT0:
admin@DUT0$ ping 10.215.168.1 count 1 size 56 timeout 1Show output
PING 10.215.168.1 (10.215.168.1) 56(84) bytes of data.
64 bytes from 10.215.168.1: icmp_seq=1 ttl=64 time=0.255 ms

--- 10.215.168.1 ping statistics ---
1 packets transmitted, 1 received, 0% packet loss, time 0ms
rtt min/avg/max/mdev = 0.255/0.255/0.255/0.000 ms
Step 6: Initiate a tcp connection from DUT1 to DUT0 and exchange messages between both endpoints
admin@DUT0$ monitor test connection server 8080 tcp
admin@DUT1$ monitor test connection client 192.168.1.1 8080 tcp
Step 7: Run the command system netflow show flows detailed on DUT0 and check whether the output matches the following regular expressions:
3\s+0\s+192.168.1.2:\d+\s+192.168.1.1:8080\s+6(\s+\S+){5}\s+[1-9]\d*
0\s+3\s+192.168.1.1:8080\s+192.168.1.2:\d+\s+6(\s+\S+){5}\s+[1-9]\d*
Show output
------------------------------------------------------------------------------------------
Field       Description
------------------------------------------------------------------------------------------
#           Numeric flow identifier
hash        Hash of the flow
a           Shows if the flow is pending of being exported
iif         Input interface
oif         Output interface
src:port    Source IP:PORT
dst:port    Destination IP:PORT
protocol    Protocol identifier
nexthop     Next-hop [Layer 4:Port]
tos         Type of service identificator
tcpflags    TCP flags
options     Optional IP options
tcpoptions  TCP Options (MSS, Window Scaling, Selective Acknowledgements, Timestamps, Nop)
pkts        Packets counter
bytes       Bytes counter
ts_first    Timestamp of fist packet that passed through the flow
ts_last     Timestamp of last packet that passed through the flow


-------------------------------------------------------------------------------------------------------------------------------------------------
#  hash  a  iif  oif  src:port           dst:port           protocol  nexthop  tos  tcpflags  options  tcpoptions  pkts  bytes  ts_first  ts_last
-------------------------------------------------------------------------------------------------------------------------------------------------
1  c54b  0  3    0    192.168.1.2:55596  192.168.1.1:8080   6         0.0.0.0  0x0  0x1b      0x0      0xf1000000  12    732    387       38
2  4162  0  0    3    192.168.1.1:8080   192.168.1.2:55596  6         0.0.0.0  0x0  0x1b      0x0      0xf1000000  9     576    387       39
Step 8: Run the command system netflow show stats on DUT0 and check whether the output matches the following regular expressions:
eth1\s+egress\s+[1-9]\d*
eth1\s+ingress\s+[1-9]\d*
Show output
--------------------------------------------------------------
iface   mode    pkts match  pkts eval  bytes match  bytes eval
--------------------------------------------------------------
eth1   egress            9         17          576        1388
eth1   ingress          12         13          732         816
--------------------------------------------------------------
Total                   21         30         1308        2204
Example 2
Step 1: Set the following configuration in DUT0 :
set interfaces ethernet eth0 address 10.215.168.64/24
set interfaces ethernet eth1 address 192.168.1.1/24
set interfaces ethernet eth1 flow egress selector TCP_SEL
set interfaces ethernet eth1 flow ingress selector TCP_SEL
set system login user admin authentication encrypted-password '$6$GSjsCj8gHLv$/VcqU6FLi6CT2Oxn0MJQ2C2tqnRDrYKNF8HIYWJp68nvXvPdFccDsT04.WtigUONbKYrgKg8d6rEs8PjljMkH0'
set system netflow destination 10.215.168.1 dtls
set system netflow engine-id 1111
set traffic selector TCP_SEL rule 1 protocol tcp
Step 2: Set the following configuration in DUT1 :
set interfaces ethernet eth1 address 192.168.1.2/24
set system login user admin authentication encrypted-password '$6$GSjsCj8gHLv$/VcqU6FLi6CT2Oxn0MJQ2C2tqnRDrYKNF8HIYWJp68nvXvPdFccDsT04.WtigUONbKYrgKg8d6rEs8PjljMkH0'
Step 3: Run the command system netflow show status on DUT0 and check whether the output matches the following regular expressions:
Protocol\sversion\s10\s\(ipfix\)
Export:.*Errors 0 pkts
sock0:\s127.0.0.1:2055,.*err: sndbuf reached 0, connect 0, cberr \d+, other 0
Show output
ipt_NETFLOW 2.6, srcversion 14D0325538497163439882E; dir
Protocol version 10 (ipfix), refresh-rate 20, timeout-rate 30, (templates 0, active 1).
Timeouts: active 1800s, inactive 15s. Maxflows 2000000
Flows: active 0 (peak 4 reached 0d3h33m ago), mem 491K, worker delay 25/250 [1..25] (52 ms, 0 us, 0:0 [cpu3]).
Hash: size 62967 (mem 491K), metric 1.00 [1.00, 1.00, 1.00]. InHash: 0 pkt, 0 K, InPDU 0, 0.
Rate: 0 bits/sec, 0 packets/sec; Avg 1 min: 286 bps, 0 pps; 5 min: 64 bps, 0 pps
cpu#     pps; <search found new [metric], trunc frag alloc maxflows>, traffic: <pkt, bytes>, drop: <pkt, bytes>
Total      0;      0     23      6 [1.00],    0    0    0    0, traffic: 29, 0 MB, drop: 0, 0 K
cpu0       0;      0      6      0 [1.00],    0    0    0    0, traffic: 6, 0 MB, drop: 0, 0 K
cpu1       0;      0     14      4 [1.00],    0    0    0    0, traffic: 18, 0 MB, drop: 0, 0 K
cpu2       0;      0      3      2 [1.00],    0    0    0    0, traffic: 5, 0 MB, drop: 0, 0 K
cpu3       0;      0      0      0 [1.00],    0    0    0    0, traffic: 0, 0 MB, drop: 0, 0 K
Export: Rate 136 bytes/s; Total 8 pkts, 0 MB, 2 flows; Errors 0 pkts; Traffic lost 8 pkts, 0 Kbytes, 4 flows.
sock0: 127.0.0.1:2055, sndbuf 212992, filled 1, peak 1; err: sndbuf reached 0, connect 0, cberr 1, other 0
Step 4: Ping the IP address 192.168.1.2 from DUT0:
admin@DUT0$ ping 192.168.1.2 count 1 size 56 timeout 1Show output
PING 192.168.1.2 (192.168.1.2) 56(84) bytes of data.
64 bytes from 192.168.1.2: icmp_seq=1 ttl=64 time=0.433 ms

--- 192.168.1.2 ping statistics ---
1 packets transmitted, 1 received, 0% packet loss, time 0ms
rtt min/avg/max/mdev = 0.433/0.433/0.433/0.000 ms
Step 5: Ping the IP address 10.215.168.1 from DUT0:
admin@DUT0$ ping 10.215.168.1 count 1 size 56 timeout 1Show output
PING 10.215.168.1 (10.215.168.1) 56(84) bytes of data.
64 bytes from 10.215.168.1: icmp_seq=1 ttl=64 time=0.426 ms

--- 10.215.168.1 ping statistics ---
1 packets transmitted, 1 received, 0% packet loss, time 0ms
rtt min/avg/max/mdev = 0.426/0.426/0.426/0.000 ms
Step 6: Initiate a tcp connection from DUT1 to DUT0 and exchange messages between both endpoints
admin@DUT0$ monitor test connection server 8080 tcp
admin@DUT1$ monitor test connection client 192.168.1.1 8080 tcp
Step 7: Run the command system netflow show flows detailed on DUT0 and check whether the output matches the following regular expressions:
3\s+0\s+192.168.1.2:\d+\s+192.168.1.1:8080\s+6(\s+\S+){5}\s+[1-9]\d*
0\s+3\s+192.168.1.1:8080\s+192.168.1.2:\d+\s+6(\s+\S+){5}\s+[1-9]\d*
Show output
------------------------------------------------------------------------------------------
Field       Description
------------------------------------------------------------------------------------------
#           Numeric flow identifier
hash        Hash of the flow
a           Shows if the flow is pending of being exported
iif         Input interface
oif         Output interface
src:port    Source IP:PORT
dst:port    Destination IP:PORT
protocol    Protocol identifier
nexthop     Next-hop [Layer 4:Port]
tos         Type of service identificator
tcpflags    TCP flags
options     Optional IP options
tcpoptions  TCP Options (MSS, Window Scaling, Selective Acknowledgements, Timestamps, Nop)
pkts        Packets counter
bytes       Bytes counter
ts_first    Timestamp of fist packet that passed through the flow
ts_last     Timestamp of last packet that passed through the flow


-------------------------------------------------------------------------------------------------------------------------------------------------
#  hash  a  iif  oif  src:port           dst:port           protocol  nexthop  tos  tcpflags  options  tcpoptions  pkts  bytes  ts_first  ts_last
-------------------------------------------------------------------------------------------------------------------------------------------------
1  d826  0  3    0    192.168.1.2:34896  192.168.1.1:8080   6         0.0.0.0  0x0  0x1b      0x0      0xf1000000  13    784    405       38
2  2593  0  0    3    192.168.1.1:8080   192.168.1.2:34896  6         0.0.0.0  0x0  0x1b      0x0      0xf1000000  9     576    405       38
Step 8: Run the command system conntrack show on DUT0 and check whether the output matches the following regular expressions:
dst=10.215.168.1.*dport=4740.*packets=[1-9]\d*Show output
udp      17 29 src=10.215.168.64 dst=10.215.168.1 sport=40359 dport=4740 packets=1 bytes=340 [UNREPLIED] src=10.215.168.1 dst=10.215.168.64 sport=4740 dport=40359 packets=0 bytes=0 mark=0 use=1
udp      17 29 src=127.0.0.1 dst=127.0.0.1 sport=55487 dport=2055 packets=1 bytes=236 [UNREPLIED] src=127.0.0.1 dst=127.0.0.1 sport=2055 dport=55487 packets=0 bytes=0 mark=0 use=1
conntrack v1.4.7 (conntrack-tools): 2 flow entries have been shown.
Step 9: Run the command system netflow show stats on DUT0 and check whether the output matches the following regular expressions:
eth1\s+egress\s+[1-9]\d*
eth1\s+ingress\s+[1-9]\d*
Show output
--------------------------------------------------------------
iface   mode    pkts match  pkts eval  bytes match  bytes eval
--------------------------------------------------------------
eth1   egress            9         16          576        1316
eth1   ingress          13         14          784         868
--------------------------------------------------------------
Total                   22         30         1360        2184
Example 3
Step 1: Set the following configuration in DUT0 :
set interfaces ethernet eth0 address 10.215.168.64/24
set interfaces ethernet eth1 address 192.168.1.1/24
set interfaces ethernet eth1 flow egress selector TCP_SEL
set interfaces ethernet eth1 flow ingress selector TCP_SEL
set system conntrack app-detect app-id-storage chained
set system login user admin authentication encrypted-password '$6$GSjsCj8gHLv$/VcqU6FLi6CT2Oxn0MJQ2C2tqnRDrYKNF8HIYWJp68nvXvPdFccDsT04.WtigUONbKYrgKg8d6rEs8PjljMkH0'
set system netflow app-id
set system netflow destination 10.215.168.1
set system netflow engine-id 1111
set traffic selector TCP_SEL rule 1 protocol tcp
Step 2: Set the following configuration in DUT1 :
set interfaces ethernet eth1 address 192.168.1.2/24
set system login user admin authentication encrypted-password '$6$GSjsCj8gHLv$/VcqU6FLi6CT2Oxn0MJQ2C2tqnRDrYKNF8HIYWJp68nvXvPdFccDsT04.WtigUONbKYrgKg8d6rEs8PjljMkH0'
Step 3: Run the command system netflow show status on DUT0 and check whether the output matches the following regular expressions:
Protocol\sversion\s10\s\(ipfix\)
Export:.*Errors 0 pkts
sock0:\s127.0.0.1:2055,.*err: sndbuf reached 0, connect 0, cberr \d+, other 0
Show output
ipt_NETFLOW 2.6, srcversion 14D0325538497163439882E; dir
Protocol version 10 (ipfix), refresh-rate 20, timeout-rate 30, (templates 0, active 1).
Timeouts: active 1800s, inactive 15s. Maxflows 2000000
Flows: active 0 (peak 4 reached 0d3h34m ago), mem 491K, worker delay 25/250 [1..25] (52 ms, 0 us, 0:0 [cpu3]).
Hash: size 62967 (mem 491K), metric 1.00 [1.00, 1.00, 1.00]. InHash: 0 pkt, 0 K, InPDU 0, 0.
Rate: 0 bits/sec, 0 packets/sec; Avg 1 min: 201 bps, 0 pps; 5 min: 103 bps, 0 pps
cpu#     pps; <search found new [metric], trunc frag alloc maxflows>, traffic: <pkt, bytes>, drop: <pkt, bytes>
Total      0;      0     43      8 [1.00],    0    0    0    0, traffic: 51, 0 MB, drop: 0, 0 K
cpu0       0;      0     12      0 [1.00],    0    0    0    0, traffic: 12, 0 MB, drop: 0, 0 K
cpu1       0;      0     27      6 [1.00],    0    0    0    0, traffic: 33, 0 MB, drop: 0, 0 K
cpu2       0;      0      3      2 [1.00],    0    0    0    0, traffic: 5, 0 MB, drop: 0, 0 K
cpu3       0;      0      1      0 [1.00],    0    0    0    0, traffic: 1, 0 MB, drop: 0, 0 K
Export: Rate 52 bytes/s; Total 13 pkts, 0 MB, 4 flows; Errors 0 pkts; Traffic lost 8 pkts, 0 Kbytes, 4 flows.
sock0: 127.0.0.1:2055, sndbuf 212992, filled 1, peak 1; err: sndbuf reached 0, connect 0, cberr 0, other 0
Step 4: Ping the IP address 192.168.1.2 from DUT0:
admin@DUT0$ ping 192.168.1.2 count 1 size 56 timeout 1Show output
PING 192.168.1.2 (192.168.1.2) 56(84) bytes of data.
64 bytes from 192.168.1.2: icmp_seq=1 ttl=64 time=0.515 ms

--- 192.168.1.2 ping statistics ---
1 packets transmitted, 1 received, 0% packet loss, time 0ms
rtt min/avg/max/mdev = 0.515/0.515/0.515/0.000 ms
Step 5: Ping the IP address 10.215.168.1 from DUT0:
admin@DUT0$ ping 10.215.168.1 count 1 size 56 timeout 1Show output
PING 10.215.168.1 (10.215.168.1) 56(84) bytes of data.
64 bytes from 10.215.168.1: icmp_seq=1 ttl=64 time=0.227 ms

--- 10.215.168.1 ping statistics ---
1 packets transmitted, 1 received, 0% packet loss, time 0ms
rtt min/avg/max/mdev = 0.227/0.227/0.227/0.000 ms
Step 6: Initiate a tcp connection from DUT1 to DUT0 and exchange messages between both endpoints
admin@DUT0$ monitor test connection server 8080 tcp
admin@DUT1$ monitor test connection client 192.168.1.1 8080 tcp
Step 7: Run the command system netflow show flows detailed on DUT0 and check whether the output matches the following regular expressions:
3\s+0\s+192.168.1.2:\d+\s+192.168.1.1:8080\s+6(\s+\S+){5}\s+[1-9]\d*
0\s+3\s+192.168.1.1:8080\s+192.168.1.2:\d+\s+6(\s+\S+){5}\s+[1-9]\d*
\[L3:\d+;L4:8080\]
Show output
------------------------------------------------------------------------------------------
Field       Description
------------------------------------------------------------------------------------------
#           Numeric flow identifier
hash        Hash of the flow
a           Shows if the flow is pending of being exported
iif         Input interface
oif         Output interface
src:port    Source IP:PORT
dst:port    Destination IP:PORT
protocol    Protocol identifier
nexthop     Next-hop [Layer 4:Port]
tos         Type of service identificator
tcpflags    TCP flags
options     Optional IP options
tcpoptions  TCP Options (MSS, Window Scaling, Selective Acknowledgements, Timestamps, Nop)
pkts        Packets counter
bytes       Bytes counter
ts_first    Timestamp of fist packet that passed through the flow
ts_last     Timestamp of last packet that passed through the flow


---------------------------------------------------------------------------------------------------------------------------------------------------------------
#  hash  a  iif  oif  src:port           dst:port           protocol  nexthop                tos  tcpflags  options  tcpoptions  pkts  bytes  ts_first  ts_last
---------------------------------------------------------------------------------------------------------------------------------------------------------------
1  9e1e  0  3    0    192.168.1.2:47462  192.168.1.1:8080   6         0.0.0.0[L3:6;L4:8080]  0x0  0x1b      0x0      0xf1000000  10    628    366       30
2  98d3  0  0    3    192.168.1.1:8080   192.168.1.2:47462  6         0.0.0.0[L3:6;L4:8080]  0x0  0x1b      0x0      0xf1000000  9     576    366       31
Step 8: Run the command system netflow show stats on DUT0 and check whether the output matches the following regular expressions:
eth1\s+egress\s+[1-9]\d*
eth1\s+ingress\s+[1-9]\d*
Show output
--------------------------------------------------------------
iface   mode    pkts match  pkts eval  bytes match  bytes eval
--------------------------------------------------------------
eth1   egress            9         16          576        1396
eth1   ingress          10         11          628         712
--------------------------------------------------------------
Total                   19         27         1204        2108