Netflow Forward
These scenarios demonstrate how to configure and use NetFlow to collect and export forwarded TCP flows, covering different modes and NAT/VRF topologies.
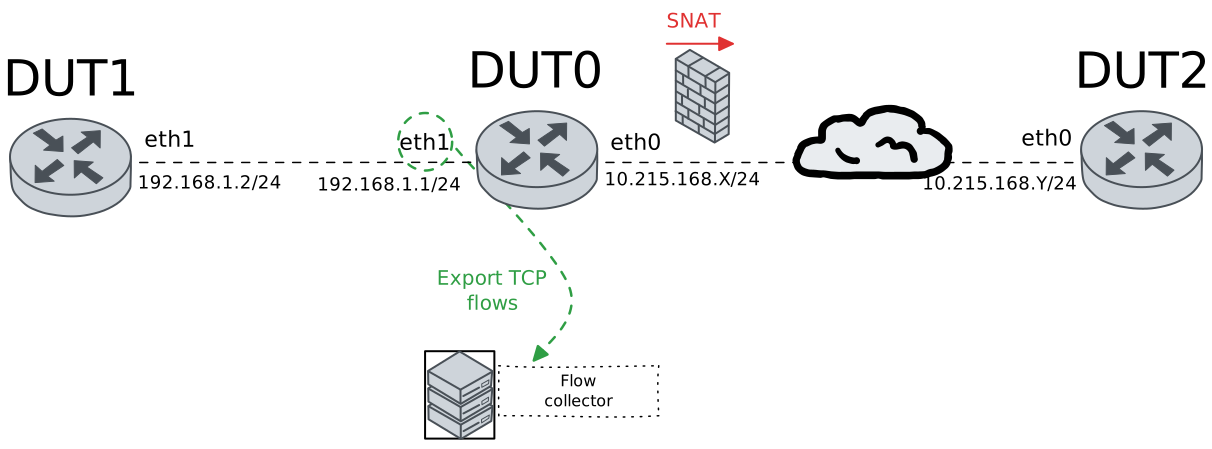
Test NetFlow Forwarding Scenario
Description
These examples demonstrate how to configure and use NetFlow to collect and export TCP forwarded flows across different NAT topologies.
Scenario
Example 1
Step 1: Set the following configuration in DUT0 :
set interfaces ethernet eth0 address 10.215.168.64/24
set interfaces ethernet eth1 address 192.168.1.1/24
set interfaces ethernet eth1 flow egress selector TCP_SEL
set interfaces ethernet eth1 flow ingress selector TCP_SEL
set system login user admin authentication encrypted-password '$6$GSjsCj8gHLv$/VcqU6FLi6CT2Oxn0MJQ2C2tqnRDrYKNF8HIYWJp68nvXvPdFccDsT04.WtigUONbKYrgKg8d6rEs8PjljMkH0'
set system netflow destination 10.215.168.1
set system netflow engine-id 1111
set traffic selector TCP_SEL rule 1 protocol tcp
Step 2: Set the following configuration in DUT1 :
set interfaces ethernet eth1 address 192.168.1.2/24
set protocols static route 0.0.0.0/0 next-hop 192.168.1.1
set system login user admin authentication encrypted-password '$6$GSjsCj8gHLv$/VcqU6FLi6CT2Oxn0MJQ2C2tqnRDrYKNF8HIYWJp68nvXvPdFccDsT04.WtigUONbKYrgKg8d6rEs8PjljMkH0'
Step 3: Set the following configuration in DUT2 :
set interfaces ethernet eth0 address 10.215.168.65/24
set protocols static route 0.0.0.0/0 next-hop 10.215.168.64
set system login user admin authentication encrypted-password '$6$GSjsCj8gHLv$/VcqU6FLi6CT2Oxn0MJQ2C2tqnRDrYKNF8HIYWJp68nvXvPdFccDsT04.WtigUONbKYrgKg8d6rEs8PjljMkH0'
Step 4: Run the command system netflow show status on DUT0 and check whether the output matches the following regular expressions:
Protocol\sversion\s10\s\(ipfix\)
Export:.*Errors 0 pkts
sock0:\s127.0.0.1:2055,.*err: sndbuf reached 0, connect 0, cberr \d+, other 0
Show output
ipt_NETFLOW 2.6, srcversion 14D0325538497163439882E; dir
Protocol version 10 (ipfix), refresh-rate 20, timeout-rate 30, (templates 0, active 1).
Timeouts: active 1800s, inactive 15s. Maxflows 2000000
Flows: active 0 (peak 4 reached 0d3h34m ago), mem 491K, worker delay 25/250 [1..25] (92 ms, 0 us, 0:0 [cpu0]).
Hash: size 62967 (mem 491K), metric 1.00 [1.00, 1.00, 1.00]. InHash: 0 pkt, 0 K, InPDU 0, 0.
Rate: 0 bits/sec, 0 packets/sec; Avg 1 min: 343 bps, 0 pps; 5 min: 149 bps, 0 pps
cpu#     pps; <search found new [metric], trunc frag alloc maxflows>, traffic: <pkt, bytes>, drop: <pkt, bytes>
Total      0;      0     60     10 [1.00],    0    0    0    0, traffic: 70, 0 MB, drop: 0, 0 K
cpu0       0;      0     12      0 [1.00],    0    0    0    0, traffic: 12, 0 MB, drop: 0, 0 K
cpu1       0;      0     44      8 [1.00],    0    0    0    0, traffic: 52, 0 MB, drop: 0, 0 K
cpu2       0;      0      3      2 [1.00],    0    0    0    0, traffic: 5, 0 MB, drop: 0, 0 K
cpu3       0;      0      1      0 [1.00],    0    0    0    0, traffic: 1, 0 MB, drop: 0, 0 K
Export: Rate 88 bytes/s; Total 16 pkts, 0 MB, 4 flows; Errors 0 pkts; Traffic lost 27 pkts, 1 Kbytes, 6 flows.
sock0: 127.0.0.1:2055, sndbuf 212992, filled 1, peak 1; err: sndbuf reached 0, connect 0, cberr 0, other 0
Step 5: Ping the IP address 192.168.1.2 from DUT0:
admin@DUT0$ ping 192.168.1.2 count 1 size 56 timeout 1Show output
PING 192.168.1.2 (192.168.1.2) 56(84) bytes of data.
64 bytes from 192.168.1.2: icmp_seq=1 ttl=64 time=0.552 ms

--- 192.168.1.2 ping statistics ---
1 packets transmitted, 1 received, 0% packet loss, time 0ms
rtt min/avg/max/mdev = 0.552/0.552/0.552/0.000 ms
Step 6: Ping the IP address 10.215.168.65 from DUT0:
admin@DUT0$ ping 10.215.168.65 count 1 size 56 timeout 1Show output
PING 10.215.168.65 (10.215.168.65) 56(84) bytes of data.
64 bytes from 10.215.168.65: icmp_seq=1 ttl=64 time=0.356 ms

--- 10.215.168.65 ping statistics ---
1 packets transmitted, 1 received, 0% packet loss, time 0ms
rtt min/avg/max/mdev = 0.356/0.356/0.356/0.000 ms
Step 7: Initiate a tcp connection from DUT1 to DUT2 and exchange messages between both endpoints
admin@DUT2$ monitor test connection server 8080 tcp
admin@DUT1$ monitor test connection client 10.215.168.65 8080 tcp
Step 8: Run the command system netflow show flows on DUT0 and check whether the output matches the following regular expressions:
3\s+2\s+192.168.1.2:\d+\s+10.215.168.65:8080\s+6(\s+\S+){0}\s+[1-9]\d*
2\s+3\s+10.215.168.65:8080\s+192.168.1.2:\d+\s+6(\s+\S+){0}\s+[1-9]\d*
Show output
-----------------------------
Field     Description
-----------------------------
iif       Input interface
oif       Output interface
src:port  Source IP:PORT
dst:port  Destination IP:PORT
protocol  Protocol identifier
pkts      Packets counter
bytes     Bytes counter


-----------------------------------------------------------------------
iif  oif  src:port            dst:port            protocol  pkts  bytes
-----------------------------------------------------------------------
3    2    192.168.1.2:50698   10.215.168.65:8080  6         12    732
2    3    10.215.168.65:8080  192.168.1.2:50698   6         11    680
Step 9: Run the command system conntrack show protocol tcp on DUT0 and check whether the output matches the following regular expressions:
src=192.168.1.2\s.*dst=10.215.168.65
src=10.215.168.65\s.*dst=192.168.1.2
\[OFFLOAD, packets=[1-9]\d* bytes=\d+ packets=[1-9]\d*
Show output
tcp      6 src=192.168.1.2 dst=10.215.168.65 sport=50698 dport=8080 packets=12 bytes=732 src=10.215.168.65 dst=192.168.1.2 sport=8080 dport=50698 packets=11 bytes=680 [ASSURED] [OFFLOAD, packets=8 bytes=516 packets=8 bytes=516] mark=0 use=4
conntrack v1.4.7 (conntrack-tools): 1 flow entries have been shown.
Step 10: Run the command system netflow show stats on DUT0 and check whether the output matches the following regular expressions:
eth1\s+egress\s+[1-9]\d*
eth1\s+ingress\s+[1-9]\d*
Show output
--------------------------------------------------------------
iface   mode    pkts match  pkts eval  bytes match  bytes eval
--------------------------------------------------------------
eth1   egress            3         12          164        1112
eth1   ingress           4          5          216         300
--------------------------------------------------------------
Total                    7         17          380        1412
Example 2
Step 1: Set the following configuration in DUT0 :
set interfaces ethernet eth0 address 10.215.168.64/24
set interfaces ethernet eth0 traffic nat source rule 1 address masquerade
set interfaces ethernet eth0 traffic nat source rule 1 selector TCP_SEL
set interfaces ethernet eth1 address 192.168.1.1/24
set interfaces ethernet eth1 flow egress selector TCP_SEL
set interfaces ethernet eth1 flow ingress selector TCP_SEL
set system login user admin authentication encrypted-password '$6$GSjsCj8gHLv$/VcqU6FLi6CT2Oxn0MJQ2C2tqnRDrYKNF8HIYWJp68nvXvPdFccDsT04.WtigUONbKYrgKg8d6rEs8PjljMkH0'
set system netflow destination 10.215.168.1
set system netflow engine-id 1111
set traffic selector TCP_SEL rule 1 protocol tcp
Step 2: Set the following configuration in DUT1 :
set interfaces ethernet eth1 address 192.168.1.2/24
set protocols static route 0.0.0.0/0 next-hop 192.168.1.1
set system login user admin authentication encrypted-password '$6$GSjsCj8gHLv$/VcqU6FLi6CT2Oxn0MJQ2C2tqnRDrYKNF8HIYWJp68nvXvPdFccDsT04.WtigUONbKYrgKg8d6rEs8PjljMkH0'
Step 3: Set the following configuration in DUT2 :
set interfaces ethernet eth0 address 10.215.168.65/24
set system login user admin authentication encrypted-password '$6$GSjsCj8gHLv$/VcqU6FLi6CT2Oxn0MJQ2C2tqnRDrYKNF8HIYWJp68nvXvPdFccDsT04.WtigUONbKYrgKg8d6rEs8PjljMkH0'
Step 4: Run the command system netflow show status on DUT0 and check whether the output matches the following regular expressions:
Protocol\sversion\s10\s\(ipfix\)
Export:.*Errors 0 pkts
sock0:\s127.0.0.1:2055,.*err: sndbuf reached 0, connect 0, cberr \d+, other 0
Show output
ipt_NETFLOW 2.6, srcversion 14D0325538497163439882E; dir
Protocol version 10 (ipfix), refresh-rate 20, timeout-rate 30, (templates 0, active 1).
Timeouts: active 1800s, inactive 15s. Maxflows 2000000
Flows: active 0 (peak 4 reached 0d3h34m ago), mem 491K, worker delay 25/250 [1..25] (48 ms, 0 us, 0:0 [cpu3]).
Hash: size 62967 (mem 491K), metric 1.00 [1.00, 1.00, 1.00]. InHash: 0 pkt, 0 K, InPDU 0, 0.
Rate: 0 bits/sec, 0 packets/sec; Avg 1 min: 571 bps, 0 pps; 5 min: 210 bps, 0 pps
cpu#     pps; <search found new [metric], trunc frag alloc maxflows>, traffic: <pkt, bytes>, drop: <pkt, bytes>
Total      0;      0     73     12 [1.00],    0    0    0    0, traffic: 93, 0 MB, drop: 0, 0 K
cpu0       0;      0     16      1 [1.00],    0    0    0    0, traffic: 17, 0 MB, drop: 0, 0 K
cpu1       0;      0     51      9 [1.00],    0    0    0    0, traffic: 56, 0 MB, drop: 0, 0 K
cpu2       0;      0      3      2 [1.00],    0    0    0    0, traffic: 5, 0 MB, drop: 0, 0 K
cpu3       0;      0      3      0 [1.00],    0    0    0    0, traffic: 15, 0 MB, drop: 0, 0 K
Export: Rate 0 bytes/s; Total 19 pkts, 0 MB, 6 flows; Errors 0 pkts; Traffic lost 27 pkts, 1 Kbytes, 6 flows.
sock0: 127.0.0.1:2055, sndbuf 212992, filled 1, peak 1; err: sndbuf reached 0, connect 0, cberr 0, other 0
Step 5: Ping the IP address 192.168.1.2 from DUT0:
admin@DUT0$ ping 192.168.1.2 count 1 size 56 timeout 1Show output
PING 192.168.1.2 (192.168.1.2) 56(84) bytes of data.
64 bytes from 192.168.1.2: icmp_seq=1 ttl=64 time=0.520 ms

--- 192.168.1.2 ping statistics ---
1 packets transmitted, 1 received, 0% packet loss, time 0ms
rtt min/avg/max/mdev = 0.520/0.520/0.520/0.000 ms
Step 6: Ping the IP address 10.215.168.65 from DUT0:
admin@DUT0$ ping 10.215.168.65 count 1 size 56 timeout 1Show output
PING 10.215.168.65 (10.215.168.65) 56(84) bytes of data.
64 bytes from 10.215.168.65: icmp_seq=1 ttl=64 time=0.423 ms

--- 10.215.168.65 ping statistics ---
1 packets transmitted, 1 received, 0% packet loss, time 0ms
rtt min/avg/max/mdev = 0.423/0.423/0.423/0.000 ms
Step 7: Initiate a tcp connection from DUT1 to DUT2 and exchange messages between both endpoints
admin@DUT2$ monitor test connection server 8080 tcp
admin@DUT1$ monitor test connection client 10.215.168.65 8080 tcp
Step 8: Run the command system netflow show flows on DUT0 and check whether the output matches the following regular expressions:
3\s+2\s+192.168.1.2:\d+\s+10.215.168.65:8080\s+6(\s+\S+){0}\s+[1-9]\d*
2\s+3\s+10.215.168.65:8080\s+192.168.1.2:\d+\s+6(\s+\S+){0}\s+[1-9]\d*
Show output
-----------------------------
Field     Description
-----------------------------
iif       Input interface
oif       Output interface
src:port  Source IP:PORT
dst:port  Destination IP:PORT
protocol  Protocol identifier
pkts      Packets counter
bytes     Bytes counter


-----------------------------------------------------------------------
iif  oif  src:port            dst:port            protocol  pkts  bytes
-----------------------------------------------------------------------
3    2    192.168.1.2:36224   10.215.168.65:8080  6         4     216
2    3    10.215.168.65:8080  192.168.1.2:36224   6         3     164
Step 9: Run the command system conntrack show protocol tcp on DUT0 and check whether the output matches the following regular expressions:
src=192.168.1.2\s.*dst=10.215.168.65
src=10.215.168.65\s.*dst=10.215.168.64
\[OFFLOAD, packets=[1-9]\d* bytes=\d+ packets=[1-9]\d*
Show output
tcp      6 src=192.168.1.2 dst=10.215.168.65 sport=36224 dport=8080 packets=12 bytes=732 src=10.215.168.65 dst=10.215.168.64 sport=8080 dport=36224 packets=11 bytes=680 [ASSURED] [OFFLOAD, packets=8 bytes=516 packets=8 bytes=516] mark=0 use=6
conntrack v1.4.7 (conntrack-tools): 1 flow entries have been shown.
Step 10: Run the command system netflow show stats on DUT0 and check whether the output matches the following regular expressions:
eth1\s+egress\s+[1-9]\d*
eth1\s+ingress\s+[1-9]\d*
Show output
--------------------------------------------------------------
iface   mode    pkts match  pkts eval  bytes match  bytes eval
--------------------------------------------------------------
eth1   egress            3          9          164         848
eth1   ingress           4          5          216         300
--------------------------------------------------------------
Total                    7         14          380        1148
Example 3
Step 1: Set the following configuration in DUT0 :
set interfaces ethernet eth0 address 10.215.168.64/24
set interfaces ethernet eth1 address 192.168.1.1/24
set interfaces ethernet eth1 flow egress selector TCP_SEL
set interfaces ethernet eth1 flow ingress selector TCP_SEL
set interfaces ethernet eth1 traffic nat destination rule 1 address 10.215.168.65
set interfaces ethernet eth1 traffic nat destination rule 1 selector TCP_SEL
set system login user admin authentication encrypted-password '$6$GSjsCj8gHLv$/VcqU6FLi6CT2Oxn0MJQ2C2tqnRDrYKNF8HIYWJp68nvXvPdFccDsT04.WtigUONbKYrgKg8d6rEs8PjljMkH0'
set system netflow destination 10.215.168.1
set system netflow engine-id 1111
set traffic selector TCP_SEL rule 1 protocol tcp
Step 2: Set the following configuration in DUT1 :
set interfaces ethernet eth1 address 192.168.1.2/24
set system login user admin authentication encrypted-password '$6$GSjsCj8gHLv$/VcqU6FLi6CT2Oxn0MJQ2C2tqnRDrYKNF8HIYWJp68nvXvPdFccDsT04.WtigUONbKYrgKg8d6rEs8PjljMkH0'
Step 3: Set the following configuration in DUT2 :
set interfaces ethernet eth0 address 10.215.168.65/24
set protocols static route 0.0.0.0/0 next-hop 10.215.168.64
set system login user admin authentication encrypted-password '$6$GSjsCj8gHLv$/VcqU6FLi6CT2Oxn0MJQ2C2tqnRDrYKNF8HIYWJp68nvXvPdFccDsT04.WtigUONbKYrgKg8d6rEs8PjljMkH0'
Step 4: Run the command system netflow show status on DUT0 and check whether the output matches the following regular expressions:
Protocol\sversion\s10\s\(ipfix\)
Export:.*Errors 0 pkts
sock0:\s127.0.0.1:2055,.*err: sndbuf reached 0, connect 0, cberr \d+, other 0
Show output
ipt_NETFLOW 2.6, srcversion 14D0325538497163439882E; dir
Protocol version 10 (ipfix), refresh-rate 20, timeout-rate 30, (templates 0, active 1).
Timeouts: active 1800s, inactive 15s. Maxflows 2000000
Flows: active 0 (peak 4 reached 0d3h35m ago), mem 491K, worker delay 25/250 [1..25] (60 ms, 0 us, 0:0 [cpu2]).
Hash: size 62967 (mem 491K), metric 1.00 [1.00, 1.00, 1.00]. InHash: 0 pkt, 0 K, InPDU 0, 0.
Rate: 0 bits/sec, 0 packets/sec; Avg 1 min: 690 bps, 0 pps; 5 min: 263 bps, 0 pps
cpu#     pps; <search found new [metric], trunc frag alloc maxflows>, traffic: <pkt, bytes>, drop: <pkt, bytes>
Total      0;      0     84     14 [1.00],    0    0    0    0, traffic: 116, 0 MB, drop: 0, 0 K
cpu0       0;      0     18      2 [1.00],    0    0    0    0, traffic: 20, 0 MB, drop: 0, 0 K
cpu1       0;      0     58     10 [1.00],    0    0    0    0, traffic: 60, 0 MB, drop: 0, 0 K
cpu2       0;      0      5      2 [1.00],    0    0    0    0, traffic: 21, 0 MB, drop: 0, 0 K
cpu3       0;      0      3      0 [1.00],    0    0    0    0, traffic: 15, 0 MB, drop: 0, 0 K
Export: Rate 136 bytes/s; Total 22 pkts, 0 MB, 8 flows; Errors 0 pkts; Traffic lost 27 pkts, 1 Kbytes, 6 flows.
sock0: 127.0.0.1:2055, sndbuf 212992, filled 1, peak 1; err: sndbuf reached 0, connect 0, cberr 0, other 0
Step 5: Ping the IP address 192.168.1.2 from DUT0:
admin@DUT0$ ping 192.168.1.2 count 1 size 56 timeout 1Show output
PING 192.168.1.2 (192.168.1.2) 56(84) bytes of data.
64 bytes from 192.168.1.2: icmp_seq=1 ttl=64 time=0.370 ms

--- 192.168.1.2 ping statistics ---
1 packets transmitted, 1 received, 0% packet loss, time 0ms
rtt min/avg/max/mdev = 0.370/0.370/0.370/0.000 ms
Step 6: Ping the IP address 10.215.168.65 from DUT0:
admin@DUT0$ ping 10.215.168.65 count 1 size 56 timeout 1Show output
PING 10.215.168.65 (10.215.168.65) 56(84) bytes of data.
64 bytes from 10.215.168.65: icmp_seq=1 ttl=64 time=0.415 ms

--- 10.215.168.65 ping statistics ---
1 packets transmitted, 1 received, 0% packet loss, time 0ms
rtt min/avg/max/mdev = 0.415/0.415/0.415/0.000 ms
Step 7: Initiate a tcp connection from DUT1 to DUT2 and exchange messages between both endpoints
admin@DUT2$ monitor test connection server 8080 tcp
admin@DUT1$ monitor test connection client 192.168.1.1 8080 tcp
Step 8: Run the command system netflow show flows on DUT0 and check whether the output matches the following regular expressions:
3\s+2\s+192.168.1.2:\d+\s+10.215.168.65:8080\s+6(\s+\S+){0}\s+[1-9]\d*
2\s+3\s+10.215.168.65:8080\s+192.168.1.2:\d+\s+6(\s+\S+){0}\s+[1-9]\d*
Show output
-----------------------------
Field     Description
-----------------------------
iif       Input interface
oif       Output interface
src:port  Source IP:PORT
dst:port  Destination IP:PORT
protocol  Protocol identifier
pkts      Packets counter
bytes     Bytes counter


-----------------------------------------------------------------------
iif  oif  src:port            dst:port            protocol  pkts  bytes
-----------------------------------------------------------------------
2    3    10.215.168.65:8080  192.168.1.2:54268   6         3     164
3    2    192.168.1.2:54268   10.215.168.65:8080  6         5     288
Step 9: Run the command system conntrack show protocol tcp on DUT0 and check whether the output matches the following regular expressions:
src=192.168.1.2\s.*dst=192.168.1.1
src=10.215.168.65\s.*dst=192.168.1.2
\[OFFLOAD, packets=[1-9]\d* bytes=\d+ packets=[1-9]\d*
Show output
tcp      6 src=192.168.1.2 dst=192.168.1.1 sport=54268 dport=8080 packets=12 bytes=732 src=10.215.168.65 dst=192.168.1.2 sport=8080 dport=54268 packets=12 bytes=732 [ASSURED] [OFFLOAD, packets=8 bytes=516 packets=9 bytes=568] mark=0 use=6
conntrack v1.4.7 (conntrack-tools): 1 flow entries have been shown.
Step 10: Run the command system netflow show stats on DUT0 and check whether the output matches the following regular expressions:
eth1\s+egress\s+[1-9]\d*
eth1\s+ingress\s+[1-9]\d*
Show output
--------------------------------------------------------------
iface   mode    pkts match  pkts eval  bytes match  bytes eval
--------------------------------------------------------------
eth1   egress            3         11          164        1040
eth1   ingress           4          5          216         300
--------------------------------------------------------------
Total                    7         16          380        1340
Example 4
Step 1: Set the following configuration in DUT0 :
set interfaces ethernet eth0 address 10.215.168.64/24
set interfaces ethernet eth0 traffic nat source rule 1 address masquerade
set interfaces ethernet eth0 traffic nat source rule 1 selector TCP_SEL
set interfaces ethernet eth1 address 192.168.1.1/24
set interfaces ethernet eth1 flow egress selector TCP_SEL
set interfaces ethernet eth1 flow ingress selector TCP_SEL
set interfaces ethernet eth1 traffic nat destination rule 1 address 10.215.168.65
set interfaces ethernet eth1 traffic nat destination rule 1 selector TCP_SEL
set system login user admin authentication encrypted-password '$6$GSjsCj8gHLv$/VcqU6FLi6CT2Oxn0MJQ2C2tqnRDrYKNF8HIYWJp68nvXvPdFccDsT04.WtigUONbKYrgKg8d6rEs8PjljMkH0'
set system netflow destination 10.215.168.1
set system netflow engine-id 1111
set traffic selector TCP_SEL rule 1 protocol tcp
Step 2: Set the following configuration in DUT1 :
set interfaces ethernet eth1 address 192.168.1.2/24
set system login user admin authentication encrypted-password '$6$GSjsCj8gHLv$/VcqU6FLi6CT2Oxn0MJQ2C2tqnRDrYKNF8HIYWJp68nvXvPdFccDsT04.WtigUONbKYrgKg8d6rEs8PjljMkH0'
Step 3: Set the following configuration in DUT2 :
set interfaces ethernet eth0 address 10.215.168.65/24
set system login user admin authentication encrypted-password '$6$GSjsCj8gHLv$/VcqU6FLi6CT2Oxn0MJQ2C2tqnRDrYKNF8HIYWJp68nvXvPdFccDsT04.WtigUONbKYrgKg8d6rEs8PjljMkH0'
Step 4: Run the command system netflow show status on DUT0 and check whether the output matches the following regular expressions:
Protocol\sversion\s10\s\(ipfix\)
Export:.*Errors 0 pkts
sock0:\s127.0.0.1:2055,.*err: sndbuf reached 0, connect 0, cberr \d+, other 0
Show output
ipt_NETFLOW 2.6, srcversion 14D0325538497163439882E; dir
Protocol version 10 (ipfix), refresh-rate 20, timeout-rate 30, (templates 0, active 1).
Timeouts: active 1800s, inactive 15s. Maxflows 2000000
Flows: active 0 (peak 4 reached 0d3h35m ago), mem 491K, worker delay 25/250 [1..25] (44 ms, 0 us, 0:0 [cpu3]).
Hash: size 62967 (mem 491K), metric 1.00 [1.00, 1.00, 1.00]. InHash: 0 pkt, 0 K, InPDU 0, 0.
Rate: 2024 bits/sec, 4 packets/sec; Avg 1 min: 879 bps, 0 pps; 5 min: 323 bps, 0 pps
cpu#     pps; <search found new [metric], trunc frag alloc maxflows>, traffic: <pkt, bytes>, drop: <pkt, bytes>
Total      4;      0     96     16 [1.00],    0    0    0    0, traffic: 140, 0 MB, drop: 0, 0 K
cpu0       0;      0     20      3 [1.00],    0    0    0    0, traffic: 23, 0 MB, drop: 0, 0 K
cpu1       0;      0     66     11 [1.00],    0    0    0    0, traffic: 65, 0 MB, drop: 0, 0 K
cpu2       4;      0      7      2 [1.00],    0    0    0    0, traffic: 37, 0 MB, drop: 0, 0 K
cpu3       0;      0      3      0 [1.00],    0    0    0    0, traffic: 15, 0 MB, drop: 0, 0 K
Export: Rate 0 bytes/s; Total 25 pkts, 0 MB, 10 flows; Errors 0 pkts; Traffic lost 27 pkts, 1 Kbytes, 6 flows.
sock0: 127.0.0.1:2055, sndbuf 212992, filled 1, peak 1; err: sndbuf reached 0, connect 0, cberr 0, other 0
Step 5: Ping the IP address 192.168.1.2 from DUT0:
admin@DUT0$ ping 192.168.1.2 count 1 size 56 timeout 1Show output
PING 192.168.1.2 (192.168.1.2) 56(84) bytes of data.
64 bytes from 192.168.1.2: icmp_seq=1 ttl=64 time=0.399 ms

--- 192.168.1.2 ping statistics ---
1 packets transmitted, 1 received, 0% packet loss, time 0ms
rtt min/avg/max/mdev = 0.399/0.399/0.399/0.000 ms
Step 6: Ping the IP address 10.215.168.65 from DUT0:
admin@DUT0$ ping 10.215.168.65 count 1 size 56 timeout 1Show output
PING 10.215.168.65 (10.215.168.65) 56(84) bytes of data.
64 bytes from 10.215.168.65: icmp_seq=1 ttl=64 time=0.415 ms

--- 10.215.168.65 ping statistics ---
1 packets transmitted, 1 received, 0% packet loss, time 0ms
rtt min/avg/max/mdev = 0.415/0.415/0.415/0.000 ms
Step 7: Initiate a tcp connection from DUT1 to DUT2 and exchange messages between both endpoints
admin@DUT2$ monitor test connection server 8080 tcp
admin@DUT1$ monitor test connection client 192.168.1.1 8080 tcp
Step 8: Run the command system netflow show flows on DUT0 and check whether the output matches the following regular expressions:
3\s+2\s+192.168.1.2:\d+\s+10.215.168.65:8080\s+6(\s+\S+){0}\s+[1-9]\d*
2\s+3\s+10.215.168.65:8080\s+192.168.1.2:\d+\s+6(\s+\S+){0}\s+[1-9]\d*
Show output
-----------------------------
Field     Description
-----------------------------
iif       Input interface
oif       Output interface
src:port  Source IP:PORT
dst:port  Destination IP:PORT
protocol  Protocol identifier
pkts      Packets counter
bytes     Bytes counter


-----------------------------------------------------------------------
iif  oif  src:port            dst:port            protocol  pkts  bytes
-----------------------------------------------------------------------
2    3    10.215.168.65:8080  192.168.1.2:58828   6         5     288
3    2    192.168.1.2:58828   10.215.168.65:8080  6         6     340
Step 9: Run the command system conntrack show protocol tcp on DUT0 and check whether the output matches the following regular expressions:
src=192.168.1.2\s.*dst=192.168.1.1
src=10.215.168.65\s.*dst=10.215.168.64
\[OFFLOAD, packets=[1-9]\d* bytes=\d+ packets=[1-9]\d*
Show output
tcp      6 src=192.168.1.2 dst=192.168.1.1 sport=58828 dport=8080 packets=10 bytes=628 src=10.215.168.65 dst=10.215.168.64 sport=8080 dport=58828 packets=11 bytes=680 [ASSURED] [OFFLOAD, packets=6 bytes=412 packets=8 bytes=516] mark=0 use=6
conntrack v1.4.7 (conntrack-tools): 1 flow entries have been shown.
Step 10: Run the command system netflow show stats on DUT0 and check whether the output matches the following regular expressions:
eth1\s+egress\s+[1-9]\d*
eth1\s+ingress\s+[1-9]\d*
Show output
--------------------------------------------------------------
iface   mode    pkts match  pkts eval  bytes match  bytes eval
--------------------------------------------------------------
eth1   egress            3         12          164        1112
eth1   ingress           4          5          216         300
--------------------------------------------------------------
Total                    7         17          380        1412
Example 5
Step 1: Set the following configuration in DUT0 :
set interfaces ethernet eth0 address 10.215.168.64/24
set interfaces ethernet eth0 vrf WAN
set interfaces ethernet eth1 address 192.168.1.1/24
set interfaces ethernet eth1 flow egress selector TCP_SEL
set interfaces ethernet eth1 flow ingress selector TCP_SEL
set interfaces ethernet eth1 vrf LAN
set protocols vrf LAN static route 0.0.0.0/0 next-hop-vrf WAN
set protocols vrf WAN static route 192.168.1.0/24 next-hop-vrf LAN
set system login user admin authentication encrypted-password '$6$GSjsCj8gHLv$/VcqU6FLi6CT2Oxn0MJQ2C2tqnRDrYKNF8HIYWJp68nvXvPdFccDsT04.WtigUONbKYrgKg8d6rEs8PjljMkH0'
set system netflow destination 10.215.168.1
set system netflow engine-id 1111
set system netflow local-vrf WAN
set system vrf LAN
set system vrf WAN
set traffic selector TCP_SEL rule 1 protocol tcp
Step 2: Set the following configuration in DUT1 :
set interfaces ethernet eth1 address 192.168.1.2/24
set protocols static route 0.0.0.0/0 next-hop 192.168.1.1
set system login user admin authentication encrypted-password '$6$GSjsCj8gHLv$/VcqU6FLi6CT2Oxn0MJQ2C2tqnRDrYKNF8HIYWJp68nvXvPdFccDsT04.WtigUONbKYrgKg8d6rEs8PjljMkH0'
Step 3: Set the following configuration in DUT2 :
set interfaces ethernet eth0 address 10.215.168.65/24
set protocols static route 0.0.0.0/0 next-hop 10.215.168.64
set system login user admin authentication encrypted-password '$6$GSjsCj8gHLv$/VcqU6FLi6CT2Oxn0MJQ2C2tqnRDrYKNF8HIYWJp68nvXvPdFccDsT04.WtigUONbKYrgKg8d6rEs8PjljMkH0'
Step 4: Run the command system netflow show status on DUT0 and check whether the output matches the following regular expressions:
Protocol\sversion\s10\s\(ipfix\)
Export:.*Errors 0 pkts
sock0:\s127.0.0.1:2055,.*err: sndbuf reached 0, connect 0, cberr \d+, other 0
Show output
ipt_NETFLOW 2.6, srcversion 14D0325538497163439882E; dir
Protocol version 10 (ipfix), refresh-rate 20, timeout-rate 30, (templates 0, active 1).
Timeouts: active 1800s, inactive 15s. Maxflows 2000000
Flows: active 0 (peak 4 reached 0d3h35m ago), mem 491K, worker delay 25/250 [1..25] (96 ms, 0 us, 0:0 [cpu1]).
Hash: size 62967 (mem 491K), metric 1.00 [1.00, 1.00, 1.00]. InHash: 0 pkt, 0 K, InPDU 0, 0.
Rate: 0 bits/sec, 0 packets/sec; Avg 1 min: 874 bps, 0 pps; 5 min: 362 bps, 0 pps
cpu#     pps; <search found new [metric], trunc frag alloc maxflows>, traffic: <pkt, bytes>, drop: <pkt, bytes>
Total      0;      0    109     18 [1.00],    0    0    0    0, traffic: 161, 0 MB, drop: 0, 0 K
cpu0       0;      0     22      4 [1.00],    0    0    0    0, traffic: 26, 0 MB, drop: 0, 0 K
cpu1       0;      0     77     12 [1.00],    0    0    0    0, traffic: 83, 0 MB, drop: 0, 0 K
cpu2       0;      0      7      2 [1.00],    0    0    0    0, traffic: 37, 0 MB, drop: 0, 0 K
cpu3       0;      0      3      0 [1.00],    0    0    0    0, traffic: 15, 0 MB, drop: 0, 0 K
Export: Rate 136 bytes/s; Total 28 pkts, 0 MB, 12 flows; Errors 0 pkts; Traffic lost 27 pkts, 1 Kbytes, 6 flows.
sock0: 127.0.0.1:2055, sndbuf 212992, filled 1, peak 1; err: sndbuf reached 0, connect 0, cberr 0, other 0
Step 5: Ping the IP address 192.168.1.2 from DUT0:
admin@DUT0$ ping 192.168.1.2 vrf LAN count 1 size 56 timeout 1Show output
ping: Warning: source address might be selected on device other than: LAN
PING 192.168.1.2 (192.168.1.2) from 192.168.1.1 LAN: 56(84) bytes of data.
64 bytes from 192.168.1.2: icmp_seq=1 ttl=64 time=0.975 ms

--- 192.168.1.2 ping statistics ---
1 packets transmitted, 1 received, 0% packet loss, time 0ms
rtt min/avg/max/mdev = 0.975/0.975/0.975/0.000 ms
Step 6: Ping the IP address 10.215.168.65 from DUT0:
admin@DUT0$ ping 10.215.168.65 vrf WAN count 1 size 56 timeout 1Show output
ping: Warning: source address might be selected on device other than: WAN
PING 10.215.168.65 (10.215.168.65) from 10.215.168.64 WAN: 56(84) bytes of data.
64 bytes from 10.215.168.65: icmp_seq=1 ttl=64 time=1.10 ms

--- 10.215.168.65 ping statistics ---
1 packets transmitted, 1 received, 0% packet loss, time 0ms
rtt min/avg/max/mdev = 1.096/1.096/1.096/0.000 ms
Step 7: Initiate a tcp connection from DUT1 to DUT2 and exchange messages between both endpoints
admin@DUT2$ monitor test connection server 8080 tcp
admin@DUT1$ monitor test connection client 10.215.168.65 8080 tcp
Step 8: Run the command system netflow show flows on DUT0 and check whether the output matches the following regular expressions:
3\s+2\s+192.168.1.2:\d+\s+10.215.168.65:8080\s+6(\s+\S+){0}\s+[1-9]\d*
2\s+3\s+10.215.168.65:8080\s+192.168.1.2:\d+\s+6(\s+\S+){0}\s+[1-9]\d*
Show output
-----------------------------
Field     Description
-----------------------------
iif       Input interface
oif       Output interface
src:port  Source IP:PORT
dst:port  Destination IP:PORT
protocol  Protocol identifier
pkts      Packets counter
bytes     Bytes counter


-----------------------------------------------------------------------
iif  oif  src:port            dst:port            protocol  pkts  bytes
-----------------------------------------------------------------------
2    3    10.215.168.65:8080  192.168.1.2:58978   6         4     216
3    2    192.168.1.2:58978   10.215.168.65:8080  6         5     288
Step 9: Run the command system conntrack show protocol tcp on DUT0 and check whether the output matches the following regular expressions:
src=192.168.1.2\s.*dst=10.215.168.65
src=10.215.168.65\s.*dst=192.168.1.2
\[OFFLOAD, packets=[1-9]\d* bytes=\d+ packets=[1-9]\d*
vrf=LAN
vrf=WAN
Show output
tcp      6 src=192.168.1.2 dst=10.215.168.65 sport=58978 dport=8080 vrf=LAN packets=14 bytes=836 src=10.215.168.65 dst=192.168.1.2 sport=8080 dport=58978 vrf=WAN packets=13 bytes=784 [ASSURED] [OFFLOAD, packets=10 bytes=620 packets=10 bytes=620] mark=0 use=4
conntrack v1.4.7 (conntrack-tools): 1 flow entries have been shown.
Step 10: Run the command system netflow show stats on DUT0 and check whether the output matches the following regular expressions:
eth1\s+egress\s+[1-9]\d*
eth1\s+ingress\s+[1-9]\d*
Show output
--------------------------------------------------------------
iface   mode    pkts match  pkts eval  bytes match  bytes eval
--------------------------------------------------------------
eth1   egress            3         11          164        1036
eth1   ingress           4          5          216         300
--------------------------------------------------------------
Total                    7         16          380        1336
Example 6
Step 1: Set the following configuration in DUT0 :
set interfaces ethernet eth0 address 10.215.168.64/24
set interfaces ethernet eth0 traffic nat source rule 1 address masquerade
set interfaces ethernet eth0 traffic nat source rule 1 selector TCP_SEL
set interfaces ethernet eth0 vrf WAN
set interfaces ethernet eth1 address 192.168.1.1/24
set interfaces ethernet eth1 flow egress selector TCP_SEL
set interfaces ethernet eth1 flow ingress selector TCP_SEL
set interfaces ethernet eth1 vrf LAN
set protocols vrf LAN static route 0.0.0.0/0 next-hop-vrf WAN
set protocols vrf WAN static route 192.168.1.0/24 next-hop-vrf LAN
set system login user admin authentication encrypted-password '$6$GSjsCj8gHLv$/VcqU6FLi6CT2Oxn0MJQ2C2tqnRDrYKNF8HIYWJp68nvXvPdFccDsT04.WtigUONbKYrgKg8d6rEs8PjljMkH0'
set system netflow destination 10.215.168.1
set system netflow engine-id 1111
set system netflow local-vrf WAN
set system vrf LAN
set system vrf WAN
set traffic selector TCP_SEL rule 1 protocol tcp
Step 2: Set the following configuration in DUT1 :
set interfaces ethernet eth1 address 192.168.1.2/24
set protocols static route 0.0.0.0/0 next-hop 192.168.1.1
set system login user admin authentication encrypted-password '$6$GSjsCj8gHLv$/VcqU6FLi6CT2Oxn0MJQ2C2tqnRDrYKNF8HIYWJp68nvXvPdFccDsT04.WtigUONbKYrgKg8d6rEs8PjljMkH0'
Step 3: Set the following configuration in DUT2 :
set interfaces ethernet eth0 address 10.215.168.65/24
set system login user admin authentication encrypted-password '$6$GSjsCj8gHLv$/VcqU6FLi6CT2Oxn0MJQ2C2tqnRDrYKNF8HIYWJp68nvXvPdFccDsT04.WtigUONbKYrgKg8d6rEs8PjljMkH0'
Step 4: Run the command system netflow show status on DUT0 and check whether the output matches the following regular expressions:
Protocol\sversion\s10\s\(ipfix\)
Export:.*Errors 0 pkts
sock0:\s127.0.0.1:2055,.*err: sndbuf reached 0, connect 0, cberr \d+, other 0
Show output
ipt_NETFLOW 2.6, srcversion 14D0325538497163439882E; dir
Protocol version 10 (ipfix), refresh-rate 20, timeout-rate 30, (templates 0, active 1).
Timeouts: active 1800s, inactive 15s. Maxflows 2000000
Flows: active 0 (peak 4 reached 0d3h35m ago), mem 491K, worker delay 25/250 [1..25] (60 ms, 0 us, 0:0 [cpu0]).
Hash: size 62967 (mem 491K), metric 1.00 [1.00, 1.00, 1.00]. InHash: 0 pkt, 0 K, InPDU 0, 0.
Rate: 0 bits/sec, 0 packets/sec; Avg 1 min: 934 bps, 0 pps; 5 min: 414 bps, 0 pps
cpu#     pps; <search found new [metric], trunc frag alloc maxflows>, traffic: <pkt, bytes>, drop: <pkt, bytes>
Total      0;      0    126     20 [1.00],    0    0    0    0, traffic: 188, 0 MB, drop: 0, 0 K
cpu0       0;      0     26      5 [1.00],    0    0    0    0, traffic: 47, 0 MB, drop: 0, 0 K
cpu1       0;      0     90     13 [1.00],    0    0    0    0, traffic: 89, 0 MB, drop: 0, 0 K
cpu2       0;      0      7      2 [1.00],    0    0    0    0, traffic: 37, 0 MB, drop: 0, 0 K
cpu3       0;      0      3      0 [1.00],    0    0    0    0, traffic: 15, 0 MB, drop: 0, 0 K
Export: Rate 136 bytes/s; Total 31 pkts, 0 MB, 14 flows; Errors 0 pkts; Traffic lost 27 pkts, 1 Kbytes, 6 flows.
sock0: 127.0.0.1:2055, sndbuf 212992, filled 1, peak 1; err: sndbuf reached 0, connect 0, cberr 0, other 0
Step 5: Ping the IP address 192.168.1.2 from DUT0:
admin@DUT0$ ping 192.168.1.2 vrf LAN count 1 size 56 timeout 1Show output
ping: Warning: source address might be selected on device other than: LAN
PING 192.168.1.2 (192.168.1.2) from 192.168.1.1 LAN: 56(84) bytes of data.
64 bytes from 192.168.1.2: icmp_seq=1 ttl=64 time=0.446 ms

--- 192.168.1.2 ping statistics ---
1 packets transmitted, 1 received, 0% packet loss, time 0ms
rtt min/avg/max/mdev = 0.446/0.446/0.446/0.000 ms
Step 6: Ping the IP address 10.215.168.65 from DUT0:
admin@DUT0$ ping 10.215.168.65 vrf WAN count 1 size 56 timeout 1Show output
ping: Warning: source address might be selected on device other than: WAN
PING 10.215.168.65 (10.215.168.65) from 10.215.168.64 WAN: 56(84) bytes of data.
64 bytes from 10.215.168.65: icmp_seq=1 ttl=64 time=0.489 ms

--- 10.215.168.65 ping statistics ---
1 packets transmitted, 1 received, 0% packet loss, time 0ms
rtt min/avg/max/mdev = 0.489/0.489/0.489/0.000 ms
Step 7: Initiate a tcp connection from DUT1 to DUT2 and exchange messages between both endpoints
admin@DUT2$ monitor test connection server 8080 tcp
admin@DUT1$ monitor test connection client 10.215.168.65 8080 tcp
Step 8: Run the command system netflow show flows on DUT0 and check whether the output matches the following regular expressions:
3\s+2\s+192.168.1.2:\d+\s+10.215.168.65:8080\s+6(\s+\S+){0}\s+[1-9]\d*
2\s+3\s+10.215.168.65:8080\s+192.168.1.2:\d+\s+6(\s+\S+){0}\s+[1-9]\d*
Show output
-----------------------------
Field     Description
-----------------------------
iif       Input interface
oif       Output interface
src:port  Source IP:PORT
dst:port  Destination IP:PORT
protocol  Protocol identifier
pkts      Packets counter
bytes     Bytes counter


-----------------------------------------------------------------------
iif  oif  src:port            dst:port            protocol  pkts  bytes
-----------------------------------------------------------------------
3    2    192.168.1.2:54802   10.215.168.65:8080  6         5     288
2    3    10.215.168.65:8080  192.168.1.2:54802   6         4     216
Step 9: Run the command system conntrack show protocol tcp on DUT0 and check whether the output matches the following regular expressions:
src=192.168.1.2\s.*dst=10.215.168.65
src=10.215.168.65\s.*dst=10.215.168.64
\[OFFLOAD, packets=[1-9]\d* bytes=\d+ packets=[1-9]\d*
vrf=LAN
vrf=WAN
Show output
tcp      6 src=192.168.1.2 dst=10.215.168.65 sport=54802 dport=8080 vrf=LAN packets=10 bytes=628 src=10.215.168.65 dst=10.215.168.64 sport=8080 dport=54802 vrf=WAN packets=10 bytes=628 [ASSURED] [OFFLOAD, packets=6 bytes=412 packets=7 bytes=464] mark=0 use=6
conntrack v1.4.7 (conntrack-tools): 1 flow entries have been shown.
Step 10: Run the command system netflow show stats on DUT0 and check whether the output matches the following regular expressions:
eth1\s+egress\s+[1-9]\d*
eth1\s+ingress\s+[1-9]\d*
Show output
--------------------------------------------------------------
iface   mode    pkts match  pkts eval  bytes match  bytes eval
--------------------------------------------------------------
eth1   egress            3         13          164        1208
eth1   ingress           4          5          216         300
--------------------------------------------------------------
Total                    7         18          380        1508
Example 7
Step 1: Set the following configuration in DUT0 :
set interfaces ethernet eth0 address 10.215.168.64/24
set interfaces ethernet eth0 vrf WAN
set interfaces ethernet eth1 address 192.168.1.1/24
set interfaces ethernet eth1 flow egress selector TCP_SEL
set interfaces ethernet eth1 flow ingress selector TCP_SEL
set interfaces ethernet eth1 traffic nat destination rule 1 address 10.215.168.65
set interfaces ethernet eth1 traffic nat destination rule 1 selector TCP_SEL
set interfaces ethernet eth1 vrf LAN
set protocols vrf LAN static route 0.0.0.0/0 next-hop-vrf WAN
set protocols vrf WAN static route 192.168.1.0/24 next-hop-vrf LAN
set system login user admin authentication encrypted-password '$6$GSjsCj8gHLv$/VcqU6FLi6CT2Oxn0MJQ2C2tqnRDrYKNF8HIYWJp68nvXvPdFccDsT04.WtigUONbKYrgKg8d6rEs8PjljMkH0'
set system netflow destination 10.215.168.1
set system netflow engine-id 1111
set system netflow local-vrf WAN
set system vrf LAN
set system vrf WAN
set traffic selector TCP_SEL rule 1 protocol tcp
Step 2: Set the following configuration in DUT1 :
set interfaces ethernet eth1 address 192.168.1.2/24
set system login user admin authentication encrypted-password '$6$GSjsCj8gHLv$/VcqU6FLi6CT2Oxn0MJQ2C2tqnRDrYKNF8HIYWJp68nvXvPdFccDsT04.WtigUONbKYrgKg8d6rEs8PjljMkH0'
Step 3: Set the following configuration in DUT2 :
set interfaces ethernet eth0 address 10.215.168.65/24
set protocols static route 0.0.0.0/0 next-hop 10.215.168.64
set system login user admin authentication encrypted-password '$6$GSjsCj8gHLv$/VcqU6FLi6CT2Oxn0MJQ2C2tqnRDrYKNF8HIYWJp68nvXvPdFccDsT04.WtigUONbKYrgKg8d6rEs8PjljMkH0'
Step 4: Run the command system netflow show status on DUT0 and check whether the output matches the following regular expressions:
Protocol\sversion\s10\s\(ipfix\)
Export:.*Errors 0 pkts
sock0:\s127.0.0.1:2055,.*err: sndbuf reached 0, connect 0, cberr \d+, other 0
Show output
ipt_NETFLOW 2.6, srcversion 14D0325538497163439882E; dir
Protocol version 10 (ipfix), refresh-rate 20, timeout-rate 30, (templates 0, active 1).
Timeouts: active 1800s, inactive 15s. Maxflows 2000000
Flows: active 0 (peak 4 reached 0d3h35m ago), mem 491K, worker delay 25/250 [1..25] (60 ms, 0 us, 0:0 [cpu2]).
Hash: size 62967 (mem 491K), metric 1.00 [1.00, 1.00, 1.00]. InHash: 0 pkt, 0 K, InPDU 0, 0.
Rate: 0 bits/sec, 0 packets/sec; Avg 1 min: 989 bps, 0 pps; 5 min: 455 bps, 0 pps
cpu#     pps; <search found new [metric], trunc frag alloc maxflows>, traffic: <pkt, bytes>, drop: <pkt, bytes>
Total      0;      0    143     22 [1.00],    0    0    0    0, traffic: 208, 0 MB, drop: 0, 0 K
cpu0       0;      0     30      6 [1.00],    0    0    0    0, traffic: 61, 0 MB, drop: 0, 0 K
cpu1       0;      0    103     14 [1.00],    0    0    0    0, traffic: 95, 0 MB, drop: 0, 0 K
cpu2       0;      0      7      2 [1.00],    0    0    0    0, traffic: 37, 0 MB, drop: 0, 0 K
cpu3       0;      0      3      0 [1.00],    0    0    0    0, traffic: 15, 0 MB, drop: 0, 0 K
Export: Rate 0 bytes/s; Total 34 pkts, 0 MB, 16 flows; Errors 0 pkts; Traffic lost 27 pkts, 1 Kbytes, 6 flows.
sock0: 127.0.0.1:2055, sndbuf 212992, filled 1, peak 1; err: sndbuf reached 0, connect 0, cberr 0, other 0
Step 5: Ping the IP address 192.168.1.2 from DUT0:
admin@DUT0$ ping 192.168.1.2 vrf LAN count 1 size 56 timeout 1Show output
ping: Warning: source address might be selected on device other than: LAN
PING 192.168.1.2 (192.168.1.2) from 192.168.1.1 LAN: 56(84) bytes of data.
64 bytes from 192.168.1.2: icmp_seq=1 ttl=64 time=0.614 ms

--- 192.168.1.2 ping statistics ---
1 packets transmitted, 1 received, 0% packet loss, time 0ms
rtt min/avg/max/mdev = 0.614/0.614/0.614/0.000 ms
Step 6: Ping the IP address 10.215.168.65 from DUT0:
admin@DUT0$ ping 10.215.168.65 vrf WAN count 1 size 56 timeout 1Show output
ping: Warning: source address might be selected on device other than: WAN
PING 10.215.168.65 (10.215.168.65) from 10.215.168.64 WAN: 56(84) bytes of data.
64 bytes from 10.215.168.65: icmp_seq=1 ttl=64 time=0.481 ms

--- 10.215.168.65 ping statistics ---
1 packets transmitted, 1 received, 0% packet loss, time 0ms
rtt min/avg/max/mdev = 0.481/0.481/0.481/0.000 ms
Step 7: Initiate a tcp connection from DUT1 to DUT2 and exchange messages between both endpoints
admin@DUT2$ monitor test connection server 8080 tcp
admin@DUT1$ monitor test connection client 192.168.1.1 8080 tcp
Step 8: Run the command system netflow show flows on DUT0 and check whether the output matches the following regular expressions:
3\s+2\s+192.168.1.2:\d+\s+10.215.168.65:8080\s+6(\s+\S+){0}\s+[1-9]\d*
2\s+3\s+10.215.168.65:8080\s+192.168.1.2:\d+\s+6(\s+\S+){0}\s+[1-9]\d*
Show output
-----------------------------
Field     Description
-----------------------------
iif       Input interface
oif       Output interface
src:port  Source IP:PORT
dst:port  Destination IP:PORT
protocol  Protocol identifier
pkts      Packets counter
bytes     Bytes counter


-----------------------------------------------------------------------
iif  oif  src:port            dst:port            protocol  pkts  bytes
-----------------------------------------------------------------------
2    3    10.215.168.65:8080  192.168.1.2:58716   6         4     216
3    2    192.168.1.2:58716   10.215.168.65:8080  6         5     288
Step 9: Run the command system conntrack show protocol tcp on DUT0 and check whether the output matches the following regular expressions:
src=192.168.1.2\s.*dst=192.168.1.1
src=10.215.168.65\s.*dst=192.168.1.2
\[OFFLOAD, packets=[1-9]\d* bytes=\d+ packets=[1-9]\d*
vrf=LAN
vrf=WAN
Show output
tcp      6 src=192.168.1.2 dst=192.168.1.1 sport=58716 dport=8080 vrf=LAN packets=10 bytes=628 src=10.215.168.65 dst=192.168.1.2 sport=8080 dport=58716 vrf=WAN packets=11 bytes=680 [ASSURED] [OFFLOAD, packets=6 bytes=412 packets=8 bytes=516] mark=0 use=4
conntrack v1.4.7 (conntrack-tools): 1 flow entries have been shown.
Step 10: Run the command system netflow show stats on DUT0 and check whether the output matches the following regular expressions:
eth1\s+egress\s+[1-9]\d*
eth1\s+ingress\s+[1-9]\d*
Show output
--------------------------------------------------------------
iface   mode    pkts match  pkts eval  bytes match  bytes eval
--------------------------------------------------------------
eth1   egress            3         13          164        1208
eth1   ingress           4          5          216         300
--------------------------------------------------------------
Total                    7         18          380        1508
Example 8
Step 1: Set the following configuration in DUT0 :
set interfaces ethernet eth0 address 10.215.168.64/24
set interfaces ethernet eth0 traffic nat source rule 1 address masquerade
set interfaces ethernet eth0 traffic nat source rule 1 selector TCP_SEL
set interfaces ethernet eth0 vrf WAN
set interfaces ethernet eth1 address 192.168.1.1/24
set interfaces ethernet eth1 flow egress selector TCP_SEL
set interfaces ethernet eth1 flow ingress selector TCP_SEL
set interfaces ethernet eth1 traffic nat destination rule 1 address 10.215.168.65
set interfaces ethernet eth1 traffic nat destination rule 1 selector TCP_SEL
set interfaces ethernet eth1 vrf LAN
set protocols vrf LAN static route 0.0.0.0/0 next-hop-vrf WAN
set protocols vrf WAN static route 192.168.1.0/24 next-hop-vrf LAN
set system login user admin authentication encrypted-password '$6$GSjsCj8gHLv$/VcqU6FLi6CT2Oxn0MJQ2C2tqnRDrYKNF8HIYWJp68nvXvPdFccDsT04.WtigUONbKYrgKg8d6rEs8PjljMkH0'
set system netflow destination 10.215.168.1
set system netflow engine-id 1111
set system netflow local-vrf WAN
set system vrf LAN
set system vrf WAN
set traffic selector TCP_SEL rule 1 protocol tcp
Step 2: Set the following configuration in DUT1 :
set interfaces ethernet eth1 address 192.168.1.2/24
set system login user admin authentication encrypted-password '$6$GSjsCj8gHLv$/VcqU6FLi6CT2Oxn0MJQ2C2tqnRDrYKNF8HIYWJp68nvXvPdFccDsT04.WtigUONbKYrgKg8d6rEs8PjljMkH0'
Step 3: Set the following configuration in DUT2 :
set interfaces ethernet eth0 address 10.215.168.65/24
set system login user admin authentication encrypted-password '$6$GSjsCj8gHLv$/VcqU6FLi6CT2Oxn0MJQ2C2tqnRDrYKNF8HIYWJp68nvXvPdFccDsT04.WtigUONbKYrgKg8d6rEs8PjljMkH0'
Step 4: Run the command system netflow show status on DUT0 and check whether the output matches the following regular expressions:
Protocol\sversion\s10\s\(ipfix\)
Export:.*Errors 0 pkts
sock0:\s127.0.0.1:2055,.*err: sndbuf reached 0, connect 0, cberr \d+, other 0
Show output
ipt_NETFLOW 2.6, srcversion 14D0325538497163439882E; dir
Protocol version 10 (ipfix), refresh-rate 20, timeout-rate 30, (templates 0, active 1).
Timeouts: active 1800s, inactive 15s. Maxflows 2000000
Flows: active 0 (peak 4 reached 0d3h36m ago), mem 491K, worker delay 25/250 [1..25] (64 ms, 0 us, 0:0 [cpu1]).
Hash: size 62967 (mem 491K), metric 1.00 [1.00, 1.00, 1.00]. InHash: 0 pkt, 0 K, InPDU 0, 0.
Rate: 0 bits/sec, 0 packets/sec; Avg 1 min: 947 bps, 0 pps; 5 min: 485 bps, 0 pps
cpu#     pps; <search found new [metric], trunc frag alloc maxflows>, traffic: <pkt, bytes>, drop: <pkt, bytes>
Total      0;      0    160     24 [1.00],    0    0    0    0, traffic: 229, 0 MB, drop: 0, 0 K
cpu0       0;      0     34      7 [1.00],    0    0    0    0, traffic: 76, 0 MB, drop: 0, 0 K
cpu1       0;      0    116     15 [1.00],    0    0    0    0, traffic: 101, 0 MB, drop: 0, 0 K
cpu2       0;      0      7      2 [1.00],    0    0    0    0, traffic: 37, 0 MB, drop: 0, 0 K
cpu3       0;      0      3      0 [1.00],    0    0    0    0, traffic: 15, 0 MB, drop: 0, 0 K
Export: Rate 0 bytes/s; Total 37 pkts, 0 MB, 18 flows; Errors 0 pkts; Traffic lost 27 pkts, 1 Kbytes, 6 flows.
sock0: 127.0.0.1:2055, sndbuf 212992, filled 1, peak 1; err: sndbuf reached 0, connect 0, cberr 0, other 0
Step 5: Ping the IP address 192.168.1.2 from DUT0:
admin@DUT0$ ping 192.168.1.2 vrf LAN count 1 size 56 timeout 1Show output
ping: Warning: source address might be selected on device other than: LAN
PING 192.168.1.2 (192.168.1.2) from 192.168.1.1 LAN: 56(84) bytes of data.
64 bytes from 192.168.1.2: icmp_seq=1 ttl=64 time=1.19 ms

--- 192.168.1.2 ping statistics ---
1 packets transmitted, 1 received, 0% packet loss, time 0ms
rtt min/avg/max/mdev = 1.186/1.186/1.186/0.000 ms
Step 6: Ping the IP address 10.215.168.65 from DUT0:
admin@DUT0$ ping 10.215.168.65 vrf WAN count 1 size 56 timeout 1Show output
ping: Warning: source address might be selected on device other than: WAN
PING 10.215.168.65 (10.215.168.65) from 10.215.168.64 WAN: 56(84) bytes of data.
64 bytes from 10.215.168.65: icmp_seq=1 ttl=64 time=0.577 ms

--- 10.215.168.65 ping statistics ---
1 packets transmitted, 1 received, 0% packet loss, time 0ms
rtt min/avg/max/mdev = 0.577/0.577/0.577/0.000 ms
Step 7: Initiate a tcp connection from DUT1 to DUT2 and exchange messages between both endpoints
admin@DUT2$ monitor test connection server 8080 tcp
admin@DUT1$ monitor test connection client 192.168.1.1 8080 tcp
Step 8: Run the command system netflow show flows on DUT0 and check whether the output matches the following regular expressions:
3\s+2\s+192.168.1.2:\d+\s+10.215.168.65:8080\s+6(\s+\S+){0}\s+[1-9]\d*
2\s+3\s+10.215.168.65:8080\s+192.168.1.2:\d+\s+6(\s+\S+){0}\s+[1-9]\d*
Show output
-----------------------------
Field     Description
-----------------------------
iif       Input interface
oif       Output interface
src:port  Source IP:PORT
dst:port  Destination IP:PORT
protocol  Protocol identifier
pkts      Packets counter
bytes     Bytes counter


-----------------------------------------------------------------------
iif  oif  src:port            dst:port            protocol  pkts  bytes
-----------------------------------------------------------------------
3    2    192.168.1.2:58444   10.215.168.65:8080  6         6     340
2    3    10.215.168.65:8080  192.168.1.2:58444   6         5     288
Step 9: Run the command system conntrack show protocol tcp on DUT0 and check whether the output matches the following regular expressions:
src=192.168.1.2\s.*dst=192.168.1.1
src=10.215.168.65\s.*dst=10.215.168.64
\[OFFLOAD, packets=[1-9]\d* bytes=\d+ packets=[1-9]\d*
vrf=LAN
vrf=WAN
Show output
tcp      6 src=192.168.1.2 dst=192.168.1.1 sport=58444 dport=8080 vrf=LAN packets=10 bytes=628 src=10.215.168.65 dst=10.215.168.64 sport=8080 dport=58444 vrf=WAN packets=9 bytes=576 [ASSURED] [OFFLOAD, packets=6 bytes=412 packets=6 bytes=412] mark=0 use=6
conntrack v1.4.7 (conntrack-tools): 1 flow entries have been shown.
Step 10: Run the command system netflow show stats on DUT0 and check whether the output matches the following regular expressions:
eth1\s+egress\s+[1-9]\d*
eth1\s+ingress\s+[1-9]\d*
Show output
--------------------------------------------------------------
iface   mode    pkts match  pkts eval  bytes match  bytes eval
--------------------------------------------------------------
eth1   egress            3         11          164        1020
eth1   ingress           4          5          216         300
--------------------------------------------------------------
Total                    7         16          380        1320