Network Monitoring
OSDx provides many tools to inspect network traffic and provide insightful statistics about how traffic is being processed in the system.
Note
Although all of the examples included below use an IPV4 address, using an IPV6 address is also possible. If more information about IPV6 is needed, please refer to chapter.
Ping
Ping is a basic Internet command that allows a user to test and verify whether a given destination IP address exists and can accept requests in computer network administration. Ping is also used to confirm that the computer the user tries to reach is operational.
An example of a good request/response will be the following:
PING 192.168.122.1 (192.168.122.1) 56(84) bytes of data.
64 bytes from 192.168.122.1: icmp_seq=1 ttl=64 time=0.581 ms
64 bytes from 192.168.122.1: icmp_seq=2 ttl=64 time=0.091 ms
64 bytes from 192.168.122.1: icmp_seq=3 ttl=64 time=0.102 ms
64 bytes from 192.168.122.1: icmp_seq=4 ttl=64 time=0.103 ms
64 bytes from 192.168.122.1: icmp_seq=5 ttl=64 time=0.127 ms
64 bytes from 192.168.122.1: icmp_seq=6 ttl=64 time=0.110 ms
64 bytes from 192.168.122.1: icmp_seq=7 ttl=64 time=0.129 ms
--- 192.168.122.1 ping statistics ---
7 packets transmitted, 7 received, 0% packet loss, time 6127ms
rtt min/avg/max/mdev = 0.091/0.177/0.581/0.165 ms
where 192.168.122.1 is the destination IP, icmp_seq are the ICMP packets sequence send to destination, ttl is the time-to-live, and time is the duration it takes to reach 192.168.122.1.
On the other hand, if the ping command is dropped, we will see something like:
PING 192.168.122.4 (192.168.122.4) 56(84) bytes of data.
From 192.168.122.3 icmp_seq=1 Destination Host Unreachable
From 192.168.122.3 icmp_seq=2 Destination Host Unreachable
From 192.168.122.3 icmp_seq=3 Destination Host Unreachable
From 192.168.122.3 icmp_seq=4 Destination Host Unreachable
From 192.168.122.3 icmp_seq=5 Destination Host Unreachable
From 192.168.122.3 icmp_seq=6 Destination Host Unreachable
--- 192.168.122.4 ping statistics ---
7 packets transmitted, 0 received, +6 errors, 100% packet loss, time 6130ms
In this case, all packets are lost because the destination host is unreachable.
If dns service is up and working, we can ping a FQDN instead of an IP address:
PING www.teldat.com (20.107.224.3) 56(84) bytes of data.
64 bytes from 20.107.224.3 (20.107.224.3): icmp_seq=1 ttl=104 time=138 ms
64 bytes from 20.107.224.3 (20.107.224.3): icmp_seq=2 ttl=104 time=155 ms
64 bytes from 20.107.224.3 (20.107.224.3): icmp_seq=3 ttl=104 time=61.7 ms
64 bytes from 20.107.224.3 (20.107.224.3): icmp_seq=4 ttl=104 time=56.6 ms
--- www.teldat.com ping statistics ---
4 packets transmitted, 4 received, 0% packet loss, time 3003ms
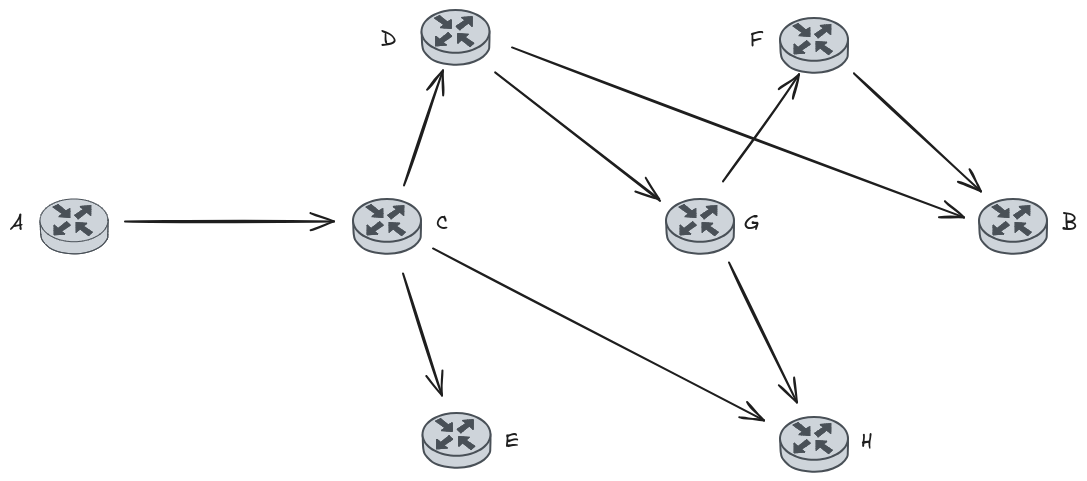
If our network topology looks like the following image (where source is A, destination is B, and the ping command is failing between A and B), instead of doing a ping to B, pinging an intermediate node (such as C or D) will be better to check if the ICMP packet is reaching these nodes (this may be useful too with the other tools described below).
Finnally, this ping feature can be combined with VRFs (virtual routing forwarding). In this case,
the command will be ping <ipv4/ipv6> vrf <VRF-Name>, where the ipv4/ipv6 destination address must be
reachable from the VRF routing table.
Example:
admin@osdx$ show running | grep VRF0
  set interfaces ethernet eth0p0 vrf VRF0
  set service dhcp-server shared-network TEST local-vrf VRF0
  set system vrf VRF0
admin@osdx$ protocols vrf VRF0 ip show route Codes: K - kernel route, C - connected, L - local, S - static, R - RIP, O - OSPF, I - IS-IS, B - BGP, E - EIGRP, N - NHRP, T - Table, v - VNC, V - VNC-Direct, A - Babel, F - PBR, f - OpenFabric, t - Table-Direct, > - selected route, * - FIB route, q - queued, r - rejected, b - backup t - trapped, o - offload failure VRF VRF0: K>* 0.0.0.0/0 [255/8192] unreachable (ICMP unreachable), weight 1, 16:56:26 C>* 100.1.1.0/24 is directly connected, eth0p0, weight 1, 16:56:22 L>* 100.1.1.1/32 is directly connected, eth0p0, weight 1, 16:56:22admin@osdx$ ping 100.1.1.10 vrf VRF0 ping: Warning: source address might be selected on device other than: VRF0 PING 100.1.1.10 (100.1.1.10) from 100.1.1.1 VRF0: 56(84) bytes of data. 64 bytes from 100.1.1.10: icmp_seq=1 ttl=64 time=0.517 ms 64 bytes from 100.1.1.10: icmp_seq=2 ttl=64 time=0.369 ms 64 bytes from 100.1.1.10: icmp_seq=3 ttl=64 time=0.380 ms 64 bytes from 100.1.1.10: icmp_seq=4 ttl=64 time=0.404 ms --- 100.1.1.10 ping statistics --- 4 packets transmitted, 4 received, 0% packet loss, time 3043ms rtt min/avg/max/mdev = 0.369/0.417/0.517/0.058 ms
Note
Despite this VRF example using the ping command, it can also work with the other tools defined in this section.
ARPing
ARPing works as Ping does, but it only sends an ARP REQUEST to a neighbour host. An example of this connection is:
ARPING 192.168.122.1 from 192.168.122.3 eth0
Unicast reply from 192.168.122.1 [55:51:3D:42:0E:FC]  0.664ms
Unicast reply from 192.168.122.1 [55:51:3D:42:0E:FC]  0.632ms
Unicast reply from 192.168.122.1 [55:51:3D:42:0E:FC]  0.634ms
Unicast reply from 192.168.122.1 [55:51:3D:42:0E:FC]  0.624ms
Unicast reply from 192.168.122.1 [55:51:3D:42:0E:FC]  0.622ms
Sent 5 probes (1 broadcast(s))
Received 5 response(s)
Traceroute
traceroute <ipv4|ipv6|txt> is a tool used to track the route packets taken from an IP network on
their way to a given host. It uses the IP protocol’s time to
live (TTL) field and attempts to elicit an ICMP TIME_EXCEEDED
response from each gateway to the host.
This program attempts to trace the route an IP packet would follow to some internet host by launching probe packets with a small ttl (time to live) then listening for an ICMP “time exceeded” reply from a gateway. We start our probes with a ttl of one and increase by one until we get an ICMP “port unreachable” (or TCP reset), which means we reached the “host” or hit a max (30 hops by default).
Examples:
admin@osdx$ traceroute 12.0.0.1
traceroute to 12.0.0.1 (12.0.0.1), 30 hops max, 60 byte packets
1  12.0.0.1  1.084 ms  0.436 ms  0.260 ms
admin@osdx$ traceroute 8.8.8.8
traceroute to 8.8.8.8 (8.8.8.8), 30 hops max, 60 byte packets
 1  12.0.0.1  0.615 ms  0.477 ms  0.322 ms
 2  192.168.214.50  0.491 ms  0.401 ms  0.523 ms
 3  192.168.191.129  0.643 ms  0.573 ms  0.500 ms
 4  192.168.191.1  0.802 ms  0.688 ms  0.730 ms
 5  172.24.10.96  1.189 ms  1.113 ms  1.018 ms
 6  195.53.109.241  1.186 ms  1.305 ms  1.146 ms
 7  193.152.72.129  3.248 ms  3.582 ms  3.206 ms
 8  81.46.14.161  7.641 ms  7.674 ms  7.605 ms
 9  81.41.246.145  7.421 ms  6.405 ms  6.807 ms
10  81.46.0.17  5.863 ms  5.790 ms  5.717 ms
11  * * *
12  213.140.50.43  4.970 ms 72.14.219.20  5.540 ms 213.140.50.43  5.101 ms
13  192.178.110.85  6.676 ms  6.092 ms 108.170.249.11  13.534 ms
14  142.251.49.55  5.098 ms 142.251.49.53  12.670 ms 142.250.239.25  12.440 ms
15  8.8.8.8  11.998 ms  12.279 ms  12.183 ms
Nslookup
nslookup <value> is a feature to query Internet domain name servers.
This is useful when an ERR_NAME_NOT_RESOLVED message is received, in order
to verify if our dns server is correctly resolving the domain name or not.
Example:
admin@osdx$ nslookup www.teldat.com
Server:               192.168.212.3
Address:      192.168.212.3#53

Name: www.teldat.com
Address: 20.107.224.3
Traffic Dump Monitor
This tool is an analyzer to monitor incoming or outgoing traffic based on different filters, such as an interface, vrf, packets or any pcap-filter. This is a really powerful tool to determine what type of traffic is going through our device and test if our network is working correctly. By way of example, we are able to monitor all icmp or arp traffic coming from IP address 192.168.122.1 (as shown below):
admin@OSDx$ traffic dump monitor interface eth0 filter "(src host 192.168.122.1) and (icmp or arp)"
tcpdump: verbose output suppressed, use -v[v]... for full protocol decode
listening on eth0, link-type EN10MB (Ethernet), snapshot length 262144 bytes
12:56:38.942725 IP 192.168.122.1 > 192.168.122.3: ICMP echo request, id 33358, seq 1, length 64
12:56:39.958309 IP 192.168.122.1 > 192.168.122.3: ICMP echo request, id 33358, seq 2, length 64
12:56:40.982331 IP 192.168.122.1 > 192.168.122.3: ICMP echo request, id 33358, seq 3, length 64
12:56:42.006337 IP 192.168.122.1 > 192.168.122.3: ICMP echo request, id 33358, seq 4, length 64
12:57:56.117992 ARP, Request who-has 192.168.122.3 tell 192.168.122.1, length 28
In addition, we are able to save the captured traffic in a .pcap file using the save <file> option as follows:
admin@osdx$ traffic dump monitor filter icmp save capture
tcpdump: listening on any, link-type LINUX_SLL (Linux cooked), capture size 262144 bytes
^C9 packets captured
9 packets received by filter
0 packets dropped by kernel
Output file was generated in '/support/capture.pcap'
Traffic Bandwidth Monitor
The traffic bandwidth monitor interface <ifc> command shows a graph displaying
the amount of traffic going through the selected interface.
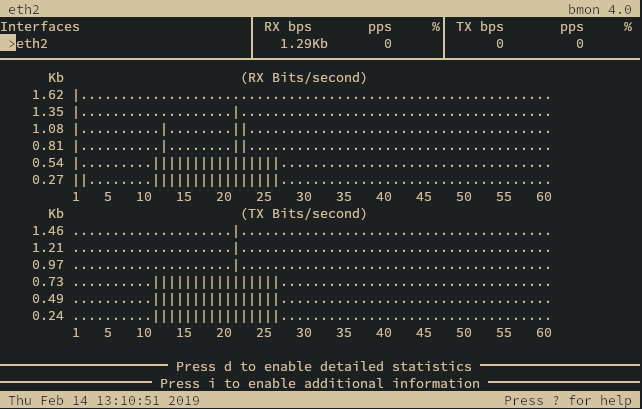
Bandwidth graph
The graph may be exited by pressing Ctrl+C.
Traffic Flow Monitor
The traffic flow monitor interface <ifc> command shows a graph displaying the
currently active network flows.
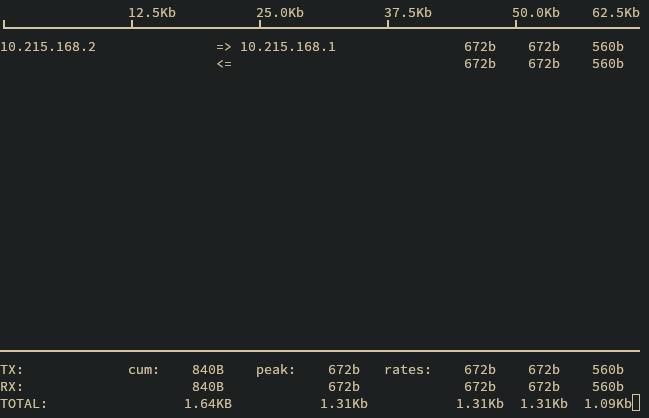
Flow graph
The graph may be exited by pressing Ctrl+C.
Warning
This command requires high cpu usage. Use it with care in high traffic scenarios.
Conntrack Monitor
Another useful command to check flows is system conntrack monitor, which shows
all state changes for every active network flow.
Example:
admin@osdx$ system conntrack monitor
    [NEW] icmp     1 30 src=10.215.168.1 dst=10.215.168.2 type=8 code=0 id=26362 [UNREPLIED] src=10.215.168.2 dst=10.215.168.1 type=0 code=0 id=26362
 [UPDATE] icmp     1 30 src=10.215.168.1 dst=10.215.168.2 type=8 code=0 id=26362 src=10.215.168.2 dst=10.215.168.1 type=0 code=0 id=26362
[DESTROY] icmp     1 src=10.215.168.1 dst=10.215.168.2 type=8 code=0 id=9835 packets=59 bytes=4956 src=10.215.168.2 dst=10.215.168.1 type=0 code=0 id=9835 packets=59 bytes=4956
conntrack v1.4.5 (conntrack-tools): 3 flow events have been shown.
The monitor session can be ended by pressing Ctrl+C.
Monitor Test Connection
The monitor test connection command performs a connection test through the transport layer.
This tool is useful to monitor the status of a connection for different protocols. These protocols
are tcp, udp and ssl. We also need to specify if the device will work as server or
client (for client mode, address server is mandatory) and the port the server will be listening to.
For more information, please refer to site.
Example

Tcp Connection
The monitor session may be ended by pressing Ctrl+C.
Monitor Test Performance
The monitor test performance command does a bandwidth test via tcp or udp,
to check the throughput in a given interface. As with the
monitor test connection command, it is necessary to specify which device will
work as server, which as client and the port to listen.
A tcp connection will be used as default, but using udp is also possible
(this option must be set at the client’s side).
Results are displayed on both the client and server. At least one line of output will be generated per measurement interval. Each line of output includes the time that has gone by since the test started, the amount of data transferred during the interval, and the average bitrate of said interval. Note that the values for each measurement interval are taken from the point of view of the endpoint process emitting that output (in other words, the output on the client shows the measurement interval data for the client).
Example

Test Performance
The monitor session may be ended by pressing Ctrl+C.
We can combine this tool with the system processes monitor command
(explained in this section)
in order to see how is the CPU consumption when an elevated traffic is incoming or outgoing.
In the following example, we can check how the Idle CPU (amount of time the CPU is not busy)
decreases a lot when the test start and increases again when the test stop.
Example
Test Performance
Click on page to learn more about this tool.