System Resources
System resources focuses on inspecting runtime system metrics (such as CPU usage, temperature, or uptime) in real time. It is also important to learn other information (like license items), to check if all your desired features are available. Additionally, some useful commands and tools to monitor and search are mentioned.
To learn about cpu usage, memory storage, fans or device temperature, you can run system overview show:
admin@osdx$ system overview show
------------------------------
     Parameter         Value
------------------------------
CPU Usage (%)             0.12
Memory Usage (%)          3.84
Storage Usage (%)          1.3
Temperature (°C)          44.0
Fan 1 speed (rpm)          720
Fan 2 speed (rpm)            0
Fan 3 speed (rpm)          780
Fan 4 speed (rpm)         2820
Thermal Zone 1 (°C)  42.850000
Thermal Zone 2 (°C)  42.850000
Thermal Zone 3 (°C)  42.850000
Thermal Zone 4 (°C)  42.850000
Thermal Zone 5 (°C)  41.850000
Thermal Zone 6 (°C)  42.850000
Thermal Zone 7 (°C)  41.850000
If we need more information about cpu usage and processes, we can use system processes.
With system processes show, we are able to see a summary of all the processes running
in our device. We can see information such as the PID, the process STAT,
the COMMAND executed by the process with all its arguments as a string, and
the accumulated cpu TIME, user + system in a “MMM:SS” format. More information about this command
can be found at page.
Example:
admin@RS420$ system processes show
  PID TTY      STAT   TIME COMMAND
  1142 ?        S<s    0:03 /usr/lib/frr/watchfrr -d -F traditional --min-restart-interval 1 --max-rest
  1151 ?        S<sl   0:01 /usr/lib/frr/zebra -d -F traditional -A 127.0.0.1 -s 90000000
  1156 ?        S<s    0:01 /usr/lib/frr/mgmtd -d -F traditional -A 127.0.0.1
  1158 ?        S<s    0:01 /usr/lib/frr/staticd -d -F traditional -A 127.0.0.1
  1215 ?        Ssl    0:52 /osdx/sbin/ubnt-cfgd
  1227 ?        S      0:00 /osdx/bin/cfgd_watchdog
  1254 ?        Ss     0:00 /osdx/sbin/osdx-switchd _eth0 0
  1447 ?        Ss     0:02 /lib/systemd/systemd-journald
  1499 ?        Ssl    0:00 /osdx/sbin/wwan-module run cell0
  1578 ?        S      0:00 [irq/68-mv88e6xxx-d0032004.mdio-mii:02-serdes-5]
  1721 ?        Ss     0:00 sshd: /usr/sbin/sshd -D [listener] 0 of 10-100 startups
  1754 ?        Ssl    0:00 /usr/sbin/rsyslogd -n -iNONE
  1815 ?        S      0:00 /usr/sbin/inetutils-inetd
  1840 ?        S      0:00 /usr/sbin/dnsmasq -x /run/dnsmasq/dnsmasq.pid -u dnsmasq -r /run/dnsmasq/re
  1944 ?        Ss     0:01 /osdx/sbin/osdx-ledsd
  1982 tty1     Ss+    0:00 /sbin/agetty -o -p -- \u --noclear - linux
  1990 ttyMV0   Ss+    0:00 /sbin/agetty -o -p -- \u --keep-baud 115200,57600,38400,9600 - vt220
  2051 ?        Ss     0:00 sshd: admin [priv]
  2065 ?        S      0:00 sshd: admin@pts/0
  2066 pts/0    Ss+    0:00 vyos-cli
  2493 ?        I      0:00 [kworker/1:1]
  4801 ?        Ss     0:00 sshd: admin [priv]
  4813 ?        S      0:00 sshd: admin@pts/1
  4814 pts/1    Ss+    0:00 vyos-cli
  5982 ?        I      0:00 [kworker/u4:2-events_power_efficient]
  6882 ?        I      0:00 [kworker/u4:1-events_power_efficient]
  7695 ?        I      0:00 [kworker/u4:0-events_unbound]
  7763 pts/1    R+     0:00 ps ax
Moreover, if we want to see a dynamic view of system processes in real time, we can run system processes monitor.
Please visit here to learn more about this tool and how to use it.
Example:
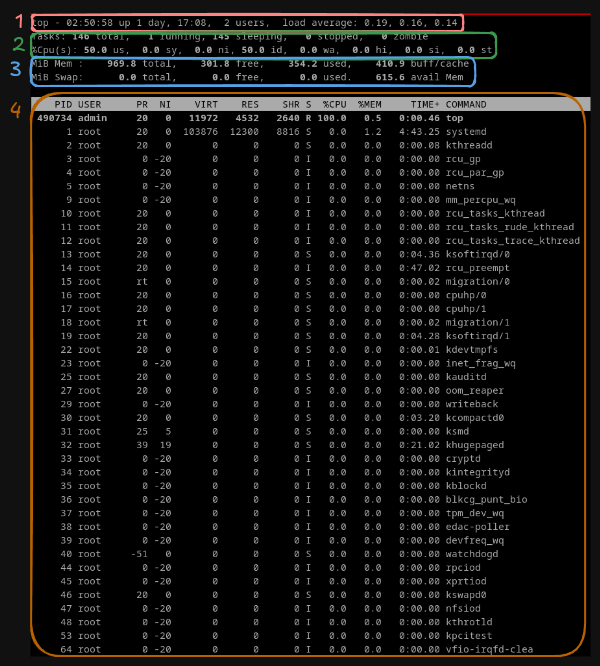
system processes monitor
Section number one consists of a single line containing:
program name
current time and length of time since last boot
total number of users
system load avg over the last 1, 5 and 15 minutes
Section number two consists of a minimum of two lines. Line 1 shows total tasks or threads, classified as: running; sleeping; stopped; zombie. Line 2 shows CPU state percentages based on the interval since the last refresh.
The third zone consists of two lines refering to memory usage. Line 1 reflects physical memory, classified as: total, free, used and buff/cache. Line 2 reflects mostly virtual memory, classified as: total, free, used and avail (which is physical memory)
The fourth and last section refers to different fields (columns) for each task:
PID: The task’s unique process ID
USER: The effective user name of the task’s owner.
PR: The scheduling priority of the task
NI: The nice value of the task. A negative nice value means higher priority, whereas a positive nice value means lower priority.
VIRT: Virtual Memory Size (KiB)
RES: Resident Memory Size (KiB)
SHR: Shared Memory Size (KiB)
S: Process Status
%CPU: CPU Usage
%MEM: Memory Usage
TIME+: Total CPU time the task has used since it started measured in hundredths.
COMMAND: Command Name or Command Line
For detailed information about memory usage, we can run show system memory detail.
admin@osdx$ show system memory detail
MemTotal:         993080 kB
MemFree:          353312 kB
MemAvailable:     664904 kB
Buffers:            8772 kB
Cached:           362052 kB
SwapCached:            0 kB
Active:           112836 kB
Inactive:         362908 kB
Active(anon):       6620 kB
Inactive(anon):   115108 kB
Active(file):     106216 kB
Inactive(file):   247800 kB
Unevictable:           0 kB
Mlocked:               0 kB
SwapTotal:             0 kB
SwapFree:              0 kB
Dirty:                 4 kB
Writeback:             0 kB
AnonPages:        102772 kB
Mapped:            45672 kB
Shmem:             16808 kB
KReclaimable:      39052 kB
Slab:              76404 kB
SReclaimable:      39052 kB
SUnreclaim:        37352 kB
KernelStack:        2720 kB
PageTables:         2216 kB
SecPageTables:         0 kB
NFS_Unstable:          0 kB
Bounce:                0 kB
WritebackTmp:          0 kB
CommitLimit:      496540 kB
Committed_AS:     429140 kB
VmallocTotal:   133143592960 kB
VmallocUsed:       11232 kB
VmallocChunk:          0 kB
Percpu:              824 kB
HardwareCorrupted:     0 kB
AnonHugePages:     14336 kB
ShmemHugePages:        0 kB
ShmemPmdMapped:        0 kB
FileHugePages:         0 kB
FilePmdMapped:         0 kB
CmaTotal:          32768 kB
CmaFree:           26832 kB
HugePages_Total:       0
HugePages_Free:        0
HugePages_Rsvd:        0
HugePages_Surp:        0
Hugepagesize:       2048 kB
Hugetlb:               0 kB
Moreover, with the show system command path, we can check much more information (i.e., modules,
packages, storage memory, usb, etc.).
Additionally, OSDx supports displaying some of these metrics in a text-based dynamic
graph through monitor system graph cpu <u32|id> and monitor system graph memory <u32|id>.
Examples:
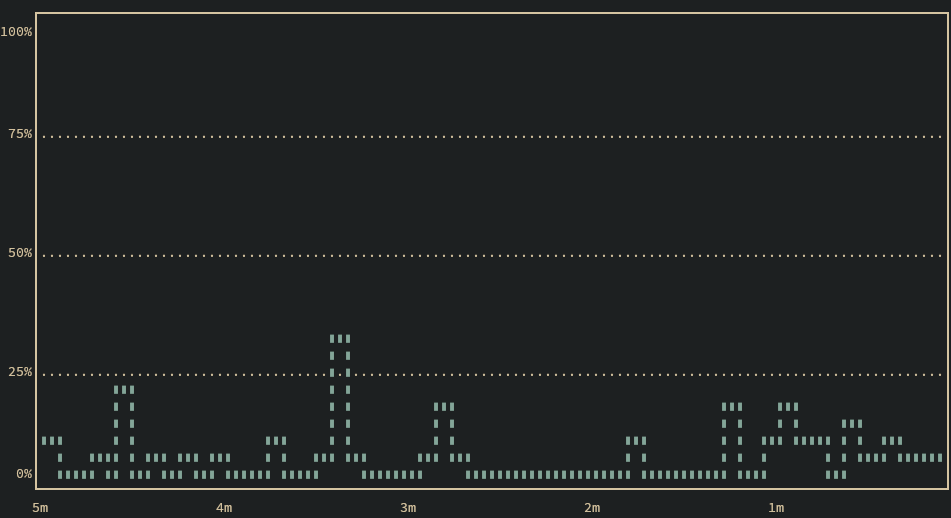
CPU graph
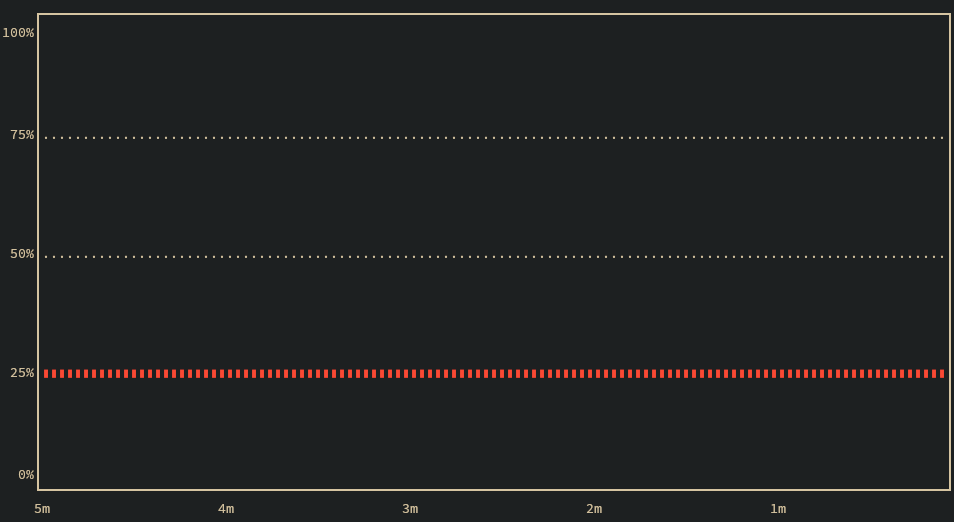
Memory graph
The graph may be exited by pressing Ctrl+C.
Many operational commands are very useful to fetch information about our system or service. For example,
using the interfaces ethernet <value> show counters command will allow us to inspect whether
packets are transmitted or received through an ethernet interface. However, this command is static,
meaning you need to execute it many times to see if counters increase or not. To solve this,
the monitor command command exists, which constantly executes the same command every 2 seconds.
Therefore, by running monitor command interfaces ethernet eth1 show counters`, we are able to refresh
this information for the eth1 interface:
Exit this command by pressing Ctrl+C.
To retrieve information about the device license, we can use license show detailed
to see the validity and status of a license item and verify whether it is out of date or not:
admin@osdx$ license show detailed
License: RS420_BASE CELL RD-ETSI WLAN

+-----------------+----------+----------+------+
| License Item    | Status   | Validity | Base |
+-----------------+----------+----------+------+
| CELL            | Enabled  | Forever  |      |
| CNM             | Enabled  | Forever  | X    |
| CPE             | Enabled  | Forever  | X    |
| Config          | Enabled  | Forever  | X    |
| DPI             | Enabled  | Forever  | X    |
| Firewall        | Enabled  | Forever  | X    |
| HWSEC           | Enabled  | Forever  | X    |
| N-Cores         | All      | Forever  | X    |
| Netflow         | Enabled  | Forever  | X    |
| RD-ETSI         | Enabled  | Forever  |      |
| RD-FCC          | Disabled | -        |      |
| RD-NOM          | Disabled | -        |      |
| RD-ROW          | Disabled | -        |      |
| WLAN            | Enabled  | Forever  |      |
| eth-Rate-Permit | Full     | Forever  | X    |
+-----------------+----------+----------+------+
Many commands display a lot of data and understanding all of their information could be impossible.
If we are looking for a pattern or some specific information, we can use the grep pipe command to
search for patterns. For example, if we run show version | grep OS, it will only show us the lines
with OS pattern. Please check manual
to learn more about this tool or run show version | grep -h to see the different options available.
Example:
admin@osdx$ show version | grep OS
  OS vendor:                 Windbit
  OS name:                   OSDx
  OS version:                v4.2.1.3
  OS Linux kernel:           6.1.55
  OS built by:               jenkins@daphne
  OS build date:             Mon Feb 3 09:56:32 UTC 2025
  OS installation:           physical
  OS boot mode:              user
  OS min bootloader:         0