Network Monitoring
OSDx provides many tools to inspect network traffic and provide insightful statistics about how traffic is being processed in the system.
Capturing traffic
The traffic dump monitor command displays all the traffic going through the router
in real time. It also provides a large range of options to modify its behavior. Two key
options are save <file>, which saves the traffic in a .pcap file, and filter
<filter> which filters the traffic using a tcpdump filter.
Examples:
admin@osdx$ traffic dump monitor
tcpdump: verbose output suppressed, use -v or -vv for full protocol decode
listening on any, link-type LINUX_SLL (Linux cooked), capture size 262144 bytes
13:09:44.352460 IP 10.215.168.1 > 10.215.168.2: ICMP echo request, id 54236, seq 1, length 64
13:09:44.352649 IP 10.215.168.2 > 10.215.168.1: ICMP echo reply, id 54236, seq 1, length 64
admin@osdx$ traffic dump monitor filter icmp save capture
tcpdump: listening on any, link-type LINUX_SLL (Linux cooked), capture size 262144 bytes
^C9 packets captured
9 packets received by filter
0 packets dropped by kernel
Output file was generated in '/support/capture.pcap'
Bandwidth
The traffic bandwidth monitor interface <iface> command shows a graph displaying
the amount of traffic going through the selected interface.
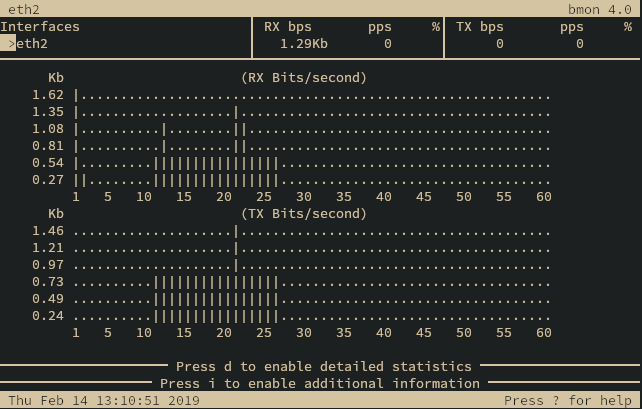
Bandwidth graph
The graph may be exited by pressing Ctrl+C.
Flows
The traffic flow monitor interfaces <iface> command shows a graph displaying the
currently active network flows.
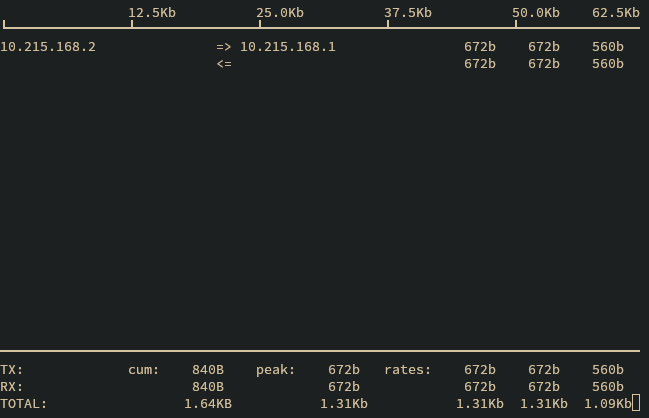
Flow graph
The graph may be exited by pressing Ctrl+C.
Another useful command for checking flows is system conntrack monitor, which shows
all state changes for every active network flow.
Example:
admin@osdx$ system conntrack monitor
    [NEW] icmp     1 30 src=10.215.168.1 dst=10.215.168.2 type=8 code=0 id=26362 [UNREPLIED] src=10.215.168.2 dst=10.215.168.1 type=0 code=0 id=26362
 [UPDATE] icmp     1 30 src=10.215.168.1 dst=10.215.168.2 type=8 code=0 id=26362 src=10.215.168.2 dst=10.215.168.1 type=0 code=0 id=26362
[DESTROY] icmp     1 src=10.215.168.1 dst=10.215.168.2 type=8 code=0 id=9835 packets=59 bytes=4956 src=10.215.168.2 dst=10.215.168.1 type=0 code=0 id=9835 packets=59 bytes=4956
^Cconntrack v1.4.5 (conntrack-tools): 3 flow events have been shown.
The monitor session may be ended by pressing Ctrl+C.
SNMP
The service snmp monitor traps community <txt> and
service snmp monitor traps user <txt> families of commands provide a way
to show the SNMP traps as they are triggered.
For more information about SNMP monitoring see the SNMP Monitoring chapter.
Example:
admin@osdx$ service snmp monitor traps community COMMUNITY2TEST
2023-06-30 22:57:11 10.0.0.1(via UDP: [10.0.0.1]:33209->[10.0.0.2]:162) TRAP, SNMP v1, community COMMUNITY2TEST
    TELDAT-OSDX-TRAPS-ALARM-MIB::alarmNotification1 Enterprise Specific Trap (0) Uptime: 1:18:39.08
    TELDAT-OSDX-TRAPS-ALARM-MIB::alarm1Name = STRING: ALARM2TEST    TELDAT-OSDX-TRAPS-ALARM-MIB::alarm1Status = INTEGER: true(1)
2023-06-30 22:57:11 10.0.0.1(via UDP: [10.0.0.1]:57094->[10.0.0.2]:162) TRAP, SNMP v1, community COMMUNITY2TEST
      TELDAT-OSDX-TRAPS-ADVISOR-MIB::advisorNotification1 Enterprise Specific Trap (0) Uptime: 1:18:39.11
      TELDAT-OSDX-TRAPS-ADVISOR-MIB::advisor1Name = STRING: ADVISOR2TEST      TELDAT-OSDX-TRAPS-ADVISOR-MIB::advisor1Status = INTEGER: true(1)